
Elementary Statistics - Excel Statistics Laboratory Manual
13th Edition
ISBN: 9780134464275
Author: Triola
Publisher: PEARSON
expand_more
expand_more
format_list_bulleted
Videos
Textbook Question
Chapter 9, Problem 5RE
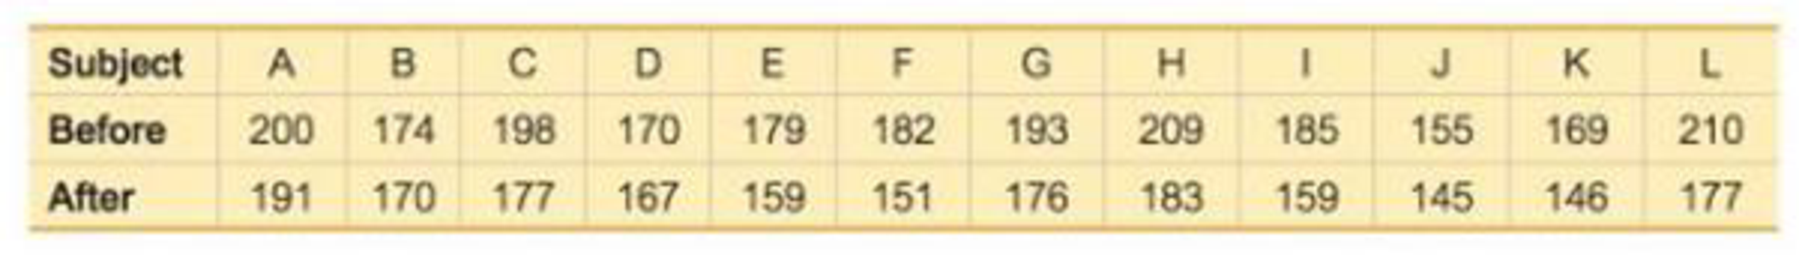
Before /After Treatment Results Captopril is a drug designed to lower systolic blood pressure. When subjects were treated with this drug, their systolic blood pressure readings (in mm Hg) were measured before and after the drug was taken. Results are given in the accompanying table (based on data from “Essential Hypertension: Effect of an Oral Inhibitor of Angiotensin-Converting Enzyme,” by MacGregor et al., British Medical Journal, Vol. 2). Using a 0.01 significance level, is there sufficient evidence to support the claim that captopril is effective in lowering systolic blood pressure?
Expert Solution & Answer
Want to see the full answer?
Check out a sample textbook solution
Students have asked these similar questions
Hoaglin, Mosteller, and Tukey (1983) presented data on blood levels of beta-endorphin as a function of stress. They took beta-endorphin levels for 19 patients 12 hours before surgery and again 10 minutes before surgery. The data are presented below, in fmol/ml
Based on these data, what effect does increased stressed have on endorphin levels.
include:
the hypotheses tested (H0 and H1),
the test-statistic and its df,
the p-value of the test, and
the conclusion as it relates to the research question.
Participant 12 hours before 10 minutes before
1 10 6.5
2 6.5 14.0
3 8.0 13.5
4 12 18
5 5.0 14.5
6 11.5…
A deficiency of the trace element selenium in the diet can negatively impact growth, immunity, muscle and neuromuscular function, and fertility. The introduction of selenium supplements to dairy cows is justified when pastures have low selenium levels. Authors of a research paper supplied the following data on milk selenium concentration (mg/L) for a sample of cows given a selenium supplement (the treatment group) and a control sample given no supplement, both initially and after a 9-day period.
Initial Measurement
Treatment
Control
11.2
9.1
9.6
8.7
10.1
9.7
8.5
10.8
10.3
10.9
10.6
10.6
11.7
10.1
9.7
12.3
10.8
8.8
10.3
10.4
10.4
10.9
11.2
10.4
9.4
11.6
10.6
10.9
10.7
8.4
After 9 Days
Treatment
Control
138.3
9.3
104
8.7
96.4
8.7
89
10.1
88
9.6
103.8
8.6
147.3
10.2
97.1
12.2
172.6
9.3
146.3
9.5
99
8.2
122.3
8.9
103
12.5
117.8
9.1
121.5
93
(a)
Use the given data for the treatment group to determine if there…
A deficiency of the trace element selenium in the diet can negatively impact growth, immunity, muscle and neuromuscular function, and fertility. The introduction of selenium supplements to dairy cows is justified when pastures have low selenium levels. Authors of a research paper supplied the following data on milk selenium concentration (mg/L) for a sample of cows given a selenium supplement (the treatment group) and a control sample given no supplement, both initially and after a 9-day period.
Initial Measurement
Treatment
Control
11.3
9.1
9.7
8.7
10.1
9.7
8.5
10.8
10.4
10.9
10.7
10.6
11.8
10.1
9.8
12.3
10.6
8.8
10.4
10.4
10.2
10.9
11.3
10.4
9.2
11.6
10.7
10.9
10.8
8.2
After 9 Days
Treatment
Control
138.3
9.4
104
8.8
96.4
8.8
89
10.1
88
9.7
103.8
8.7
147.3
10.3
97.1
12.3
172.6
9.4
146.3
9.5
99
8.3
122.3
8.9
103
12.5
117.8
9.1
121.5
93
(a)
Use the given data for the treatment group to determine if…
Chapter 9 Solutions
Elementary Statistics - Excel Statistics Laboratory Manual
Ch. 9.1 - Verifying Requirements In the largest clinical...Ch. 9.1 - Verifying Requirements In the largest clinical...Ch. 9.1 - Hypotheses and Conclusions Refer to the hypothesis...Ch. 9.1 - Using Confidence Intervals a. Assume that we want...Ch. 9.1 - Interpreting Displays. In Exercises 5 and 6, use...Ch. 9.1 - Treating Carpal Tunnel Syndrome Carpal tunnel...Ch. 9.1 - Testing Claims About Proportions. In Exercises...Ch. 9.1 - Accuracy of Fast Food Drive-Through Orders In a...Ch. 9.1 - Testing Claims About Proportions. In Exercises...Ch. 9.1 - Testing Claims About Proportions. In Exercises...
Ch. 9.1 - Testing Claims About Proportions. In Exercises...Ch. 9.1 - Testing Claims About Proportions. In Exercises...Ch. 9.1 - Testing Claims About Proportions. In Exercises...Ch. 9.1 - Testing Claims About Proportions. In Exercises...Ch. 9.1 - Testing Claims About Proportions. In Exercises...Ch. 9.1 - Prob. 16BSCCh. 9.1 - Testing Claims About Proportions. In Exercises...Ch. 9.1 - Testing Claims About Proportions. In Exercises...Ch. 9.1 - Testing Claims About Proportions. In Exercises...Ch. 9.1 - Testing Claims About Proportions. In Exercises...Ch. 9.1 - Testing Claims About Proportions. In Exercises...Ch. 9.1 - Testing Claims About Proportions. In Exercises...Ch. 9.1 - Prob. 23BBCh. 9.1 - Yawning and Fishers Exact Test In one segment of...Ch. 9.1 - Overlap of Confidence Intervals In the article On...Ch. 9.1 - Equivalence of Hypothesis Test and Confidence...Ch. 9.2 - Independent and Dependent Samples Which of the...Ch. 9.2 - Confidence Interval for Hemoglobin Large samples...Ch. 9.2 - Hypothesis Tests and Confidence Intervals for...Ch. 9.2 - Degrees of Freedom For Example 1 on page 431, we...Ch. 9.2 - In Exercises 520, assume that the two samples are...Ch. 9.2 - In Exercises 520, assume that the two samples are...Ch. 9.2 - In Exercises 520, assume that the two samples are...Ch. 9.2 - In Exercises 520, assume that the two samples are...Ch. 9.2 - In Exercises 520, assume that the two samples are...Ch. 9.2 - In Exercises 520, assume that the two samples are...Ch. 9.2 - In Exercises 520, assume that the two samples are...Ch. 9.2 - In Exercises 520, assume that the two samples are...Ch. 9.2 - In Exercises 520, assume that the two samples are...Ch. 9.2 - In Exercises 520, assume that the two samples are...Ch. 9.2 - In Exercises 520, assume that the two samples are...Ch. 9.2 - In Exercises 520, assume that the two samples are...Ch. 9.2 - In Exercises 520, assume that the two samples are...Ch. 9.2 - In Exercises 520, assume that the two samples are...Ch. 9.2 - In Exercises 520, assume that the two samples are...Ch. 9.2 - In Exercises 520, assume that the two samples are...Ch. 9.2 - Larger Data Sets. In Exercises 2124, use the...Ch. 9.2 - Larger Data Sets. In Exercises 2124, use the...Ch. 9.2 - Larger Data Sets. In Exercises 2124, use the...Ch. 9.2 - Larger Data Sets. In Exercises 2124, use the...Ch. 9.2 - Pooling Repeat Exercise 12 IQ and Lead by assuming...Ch. 9.2 - Degrees of Freedom In Exercise 20 Blanking Out on...Ch. 9.2 - No Variation in a Sample An experiment was...Ch. 9.3 - True? For the methods of this section, which of...Ch. 9.3 - Notation Listed below are body temperatures from...Ch. 9.3 - Units of Measure If the values listed in Exercise...Ch. 9.3 - Degrees of Freedom If we use the sample data in...Ch. 9.3 - In Exercises 516, use the listed paired sample...Ch. 9.3 - In Exercises 516, use the listed paired sample...Ch. 9.3 - In Exercises 516, use the listed paired sample...Ch. 9.3 - In Exercises 516, use the listed paired sample...Ch. 9.3 - In Exercises 516, use the listed paired sample...Ch. 9.3 - In Exercises 516, use the listed paired sample...Ch. 9.3 - Prob. 11BSCCh. 9.3 - Prob. 12BSCCh. 9.3 - In Exercises 516, use the listed paired sample...Ch. 9.3 - In Exercises 516, use the listed paired sample...Ch. 9.3 - In Exercises 516, use the listed paired sample...Ch. 9.3 - In Exercises 516, use the listed paired sample...Ch. 9.3 - Prob. 17BSCCh. 9.3 - Larger Data Sets. In Exercises 1724, use the...Ch. 9.3 - Larger Data Sets. In Exercises 1724, use the...Ch. 9.3 - Larger Data Sets. In Exercises 1724, use the...Ch. 9.3 - Larger Data Sets. In Exercises 1724, use the...Ch. 9.3 - Larger Data Sets. In Exercises 1724, use the...Ch. 9.3 - Prob. 23BSCCh. 9.3 - Prob. 24BSCCh. 9.3 - Body Temperatures Refer to Data Set 3 Body...Ch. 9.4 - F Test Statistic a. If s12 represents the larger...Ch. 9.4 - F Test if using the sample data in Data Set 1 Body...Ch. 9.4 - Testing Normality For the hypothesis test...Ch. 9.4 - Prob. 4BSCCh. 9.4 - In Exercises 516, test the given claim. 5. Color...Ch. 9.4 - In Exercises 516, test the given claim. 6. Color...Ch. 9.4 - In Exercises 516, test the given claim. 7. Testing...Ch. 9.4 - In Exercises 516, test the given claim. 8....Ch. 9.4 - In Exercises 516, test the given claim. 9. Coke...Ch. 9.4 - In Exercises 516, test the given claim. 10. IQ and...Ch. 9.4 - Prob. 11BSCCh. 9.4 - Prob. 12BSCCh. 9.4 - Prob. 13BSCCh. 9.4 - Prob. 14BSCCh. 9.4 - In Exercises 516, test the given claim. 15. Old...Ch. 9.4 - In Exercises 516, test the given claim. 16....Ch. 9.4 - Prob. 17BBCh. 9.4 - Prob. 18BBCh. 9.4 - Finding Lower Critical F Values For hypothesis...Ch. 9 - In Exercises 15, use the following survey results:...Ch. 9 - In Exercises 1-5, use the following survey...Ch. 9 - In Exercises 1-5, use the following survey...Ch. 9 - In Exercises 1-5, use the following survey...Ch. 9 - In Exercises 7-5, use the following survey...Ch. 9 - True? Determine whether the following statement is...Ch. 9 - True? When we collect random samples to test the...Ch. 9 - Dependent or Independent? Listed below are...Ch. 9 - Hypotheses Identify the null and alternative...Ch. 9 - Test Statistics Identify the test statistic that...Ch. 9 - Denomination Effect In the article The...Ch. 9 - Denomination Effect Construct the confidence...Ch. 9 - Heights Listed below are heights (cm) randomly...Ch. 9 - Heights Use a 0.01 significance level with the...Ch. 9 - Before /After Treatment Results Captopril is a...Ch. 9 - Eyewitness Accuracy of Police Does stress affect...Ch. 9 - Are Flights Cheaper When Scheduled Earlier? Listed...Ch. 9 - Variation of Heights Use the sample data given in...Ch. 9 - Family Heights. In Exercises 15, use the following...Ch. 9 - Scatterplot Construct a scatterplot of the...Ch. 9 - Family Heights. In Exercises 1-5, use the...Ch. 9 - Family Heights. In Exercises 1-5, use the...Ch. 9 - Assessing Normality Interpret the normal quantile...Ch. 9 - Braking Reaction Times: Histogram Listed below are...Ch. 9 - Braking Reaction Times: Normal? The accompanying...Ch. 9 - Braking Reaction Times: Boxplots Use the same data...Ch. 9 - In Exercises 5-20, assume that the two samples are...Ch. 9 - Braking Reaction Times: Confidence Intervals a....Ch. 9 - FROM DATA TO DECISION Critical Thinking: Did the...Ch. 9 - Critical Thinking: Did the NFL Rule Change Have...Ch. 9 - Critical Thinking: Did the NFL Rule Change Have...
Knowledge Booster


Learn more about
Need a deep-dive on the concept behind this application? Look no further. Learn more about this topic, statistics and related others by exploring similar questions and additional content below.Similar questions
- A deficiency of the trace element selenium in the diet can negatively impact growth, immunity, muscle and neuromuscular function, and fertility. The introduction of selenium supplements to dairy cows is justified when pastures have low selenium levels. Authors of a research paper supplied the following data on milk selenium concentration (mg/L) for a sample of cows given a selenium supplement (the treatment group) and a control sample given no supplement, both initially and after a 9-day period. Initial Measurement Treatment Control 11.4 9.1 9.6 8.7 10.1 9.7 8.5 10.8 10.2 10.9 10.6 10.6 11.9 10.1 9.9 12.3 10.7 8.8 10.2 10.4 10.3 10.9 11.4 10.4 9.3 11.6 10.6 10.9 10.9 8.3 After 9 Days Treatment Control 138.3 9.2 104 8.9 96.4 8.9 89 10.1 88 9.6 103.8 8.6 147.3 10.4 97.1 12.4 172.6 9.2 146.3 9.5 99 8.4 122.3 8.8 103 12.5 117.8 9.1 121.5 93 (a) Use the given data for the treatment group to determine if…arrow_forwardThe cholesterol-reducing drug Lipitor consists of atorvastatin calcium. Results (based on data from the company Parke-Davis) summarising the incidence of headaches as an adverse reaction in clinical tests are given below. We are interested in evaluating the evidence that the incidence of headaches is dependent on the amount of atorvastatin used. Placebo Atorvastatin 10 mg Atorvastatin 20 mg Atorvastatin 40 mg Atorvastatin 80 mg Headache 19 47 6 2 6 No headache 251 816 30 77 88 1. If level of atorvastatin was independent of incidence of headaches, what would be the expected frequency in the headache and 20 mg cell? Would this cause any concern for a test of independence of these factors? Why? 2. Combine the 20 mg and 40 mg results into one column, then perform a chi-squared hypothesis test at the 1% significance level to evaluate the evidence that the incidence of headaches is dependent on the amount of atorvastatin used.arrow_forwardA test of body reaction to the Malaysian citizens who have taken their vaccine was conducted. Selected citizens who got side effect are categorised according to their blood type and the type of vaccine received. From a sample of 250 citizens, 150 of them were administered withSinovac while the rest received AstraZeneca. Table 4 shows the number of citizens who had side effect after being vaccinated. (Question & Table at images)arrow_forward
- A physiologist has conducted an experiment to evaluate the effect of hormone X on sexual behavior. Ten rats were injected with hormone X and 10 other rats received a placebo injection. The number of matings was counted over a 20-minute period. The results are shown in the table below. Table 1: Data from hormone X experiment Group 1 Hormone X Group 2 Placebo X1 (X1) 2 X2 (X1) 2 8 64 5 25 10 100 6 36 12 144 3 9 6 36 4 16 6 36 7 49 7 49 8 64 9 81 6 36 8 64 5 25 7 49 4 16 11 121 8 64 84 744 56 340 a) What is the alternative hypothesis? Use a nondirectional hypothesis. b) What is the null hypothesis? c) What do you conclude? Use α = 0.05 (2-tail)arrow_forwardArterial Cord pH. Umbilical cord blood analysis immediately after delivery is one way to measure the health of an infant after birth. Researchers G. Natalucci et al. used it as a predictor of brain maturation of preterm infants in the article “Functional Brain Maturation Assessed During Early Life Correlates with Anatomical Brain Maturation at Term-Equivalent Age in Preterm Infants” (Pediatric Research, Vol. 74. No. 1, pp. 68–74). Based on this study, we will assume that, for preterm infants, the pH level of the arterial cord (one vessel in the umbilical cord) is normally distributed with mean 7.32 and standard deviation 0.1. Find the percentage of preterm infants who have arterial cord pH levels a. between 7.0 and 7.5. b. over 7.4.arrow_forwardWe are testing whether a particular program of low impact exercise can improve the cholesterol level of stroke patients. We enroll a group of stroke patients in our study, and after six weeks we measure their serum cholesterol level in mmol/L, resulting in the following data: 6.1 9.3 6.3 4 9 5.5 6.3 4.2 4.7 7.8 4.3 7.5 9.1 4.2 6.9 8.1 5.6 9.4 8.3 8.8 7.2 5.7 6.5 3.8 3.8 9 9.4 4.5 8 7 4.5 9.4 6.6 4.1 6.6 9.1 3.9 5.3 (a) Construct a 95% confidence interval. _______< u < ______ From an existing study, we know that the average cholesterol level of all stroke patients is 7 mmol/L. We want to know if the level in our patients is significantly different from this. (b) What is our Test statistic? ______ (c) What is the two-tailed p-value of this result? ______arrow_forward
- A fast-food chain decided to carry out an experiment to assess the influence of advertising expenditure on sales. Different relative changes in advertising expenditure, compared to the previous year, were made in eight regions of the country, and resulting changes in sales levels were observed the accompanying table shows the results. Increase in advertising expenditure (%) 0 5 15 20 25 30 35 40 Increase in sales (%) 5 10 18 25 35 50 60 65 Determine the value of ∑X, ∑X2, ∑Y, ∑Y2, ∑XY. Where X represent independent variable and Y for dependent variable. Determine and interpret the coefficient of correlation between the two variables. Determine the value of regressions coefficients and write down the simple linear regression model.…arrow_forwardA fast-food chain decided to carry out an experiment to assess the influence of advertising expenditure on sales. Different relative changes in advertising expenditure, compared to the previous year, were made in eight regions of the country, and resulting changes in sales levels were observed the accompanying table shows the results. Increase in advertising expenditure (%) 0 5 15 20 25 30 35 40 Increase in sales (%) 5 10 18 25 35 50 60 65 Determine the value of ∑X, ∑X2, ∑Y, ∑Y2, ∑XY. Where X represent independent variable and Y for dependent variable. Determine and interpret the coefficient of correlation between the two variables. Determine the value of regressions coefficients and write down the simple linear regression model. Test the validity of the model…arrow_forwardAll Fresh Seafood is a wholesale fish company based on the east coast of the U.S. Catalina Offshore Products is a wholesale fish company based on the west coast of the U.S. Table #9.2.5 contains prices from both companies for specific fish types ("Seafood online," 2013) ("Buy sushi grade," 2013). Do the data provide enough evidence to show that a west coast fish wholesaler is more expensive than an east coast wholesaler? Test at the 5% level. (Show work) Table #9.2.5: Wholesale Prices of Fish in Dollars Fish All Fresh Seafood Prices Catalina Offshore Products Prices Cod 19.99 17.99 Tilapi 6.00 13.99 Farmed Salmon 19.99 22.99 Organic Salmon 24.99 24.99 Grouper Fillet 29.99 19.99 Tuna 28.99 31.99 Swordfish 23.99 23.99 Sea Bass 32.99 23.99 Striped Bass 29.99 14.99arrow_forward
- Low-Birth-Weight Hospital Stays. Data on low-birthweight babies were collected over a 2-year period by 14 participating centers of the National Institute of Child Health and Human Development Neonatal Research Network. Results were reported by J. Lemons et al. in the on-line paper “Very Low Birth Weight Outcomes of the National Institute of ChildHealth and Human Development Neonatal Research Network” (Pediatrics, Vol. 107, No. 1, p. e1). For the 1084 surviving babies whose birth weights were 751– 1000 grams, the average length of stay in the hospital was 86 days, although one center had an average of 66 days and another had an average of 108 days. a. Can the mean lengths of stay be considered population means? Explain your answer.b. Assuming that the population standard deviation is 12 days, determine the z-score for a baby’s length of stay of 86 days at the center where the mean was 66 days.c. Assuming that the population standard deviation is 12 days, determine the z-score for a…arrow_forwardBlood cocaine concentration (mg/L) was determinedboth for a sample of individuals who had died fromcocaine-induced excited delirium (ED) and for a sampleof those who had died from a cocaine overdose withoutexcited delirium; survival time for people in bothgroups was at most 6 hours. The accompanying datawas read from a comparative boxplot in the article“Fatal Excited Delirium Following Cocaine Use” (J.of Forensic Sciences, 1997: 25–31). ED 0 0 0 0 .1 .1 .1 .1 .2 .2 .3 .3.3 .4 .5 .7 .8 1.0 1.5 2.7 2.83.5 4.0 8.9 9.2 11.7 21.0Non-ED 0 0 0 0 0 .1 .1 .1 .1 .2 .2 .2.3 .3 .3 .4 .5 .5 .6 .8 .9 1.01.2 1.4 1.5 1.7 2.0 3.2 3.5 4.14.3 4.8 5.0 5.6 5.9 6.0 6.4 7.98.3 8.7 9.1 9.6 9.9 11.0 11.512.2 12.7 14.0 16.6 17.8 a. Determine the medians, fourths, and fourth spreadsfor the two samples.b. Are there any outliers in either sample? Any extremeoutliers?c. Construct a comparative boxplot, and use it as abasis for comparing and contrasting the ED andnon-ED samples.arrow_forwardIn a study of palatability of antibiotics for children, Doreen Matsui and her colleagues used a voluntary sample of healthy children to assess their reactions to the taste of four antibiotics. The children’s responses were measured on a 10-centimeter visual analog scale that incorporated the use of faces, from sad (low score) to happy (high score). The minimum and maximum scores were, respectively, 0 and 10. The data in the following table (simulated from the results given in Matsui’s report) were obtained when each of five children were asked to rate the taste of all four antibiotics. AntibioticChild I II III IV 1 4.8 2.2 6.8 6.22 8.1 9.2 6.6 9.63 5.0 2.6 3.6 6.54 7.9 9.4 5.3 8.55 3.9 7.4 2.1…arrow_forward
arrow_back_ios
SEE MORE QUESTIONS
arrow_forward_ios
Recommended textbooks for you
 Glencoe Algebra 1, Student Edition, 9780079039897...AlgebraISBN:9780079039897Author:CarterPublisher:McGraw Hill
Glencoe Algebra 1, Student Edition, 9780079039897...
Algebra
ISBN:9780079039897
Author:Carter
Publisher:McGraw Hill
Hypothesis Testing using Confidence Interval Approach; Author: BUM2413 Applied Statistics UMP;https://www.youtube.com/watch?v=Hq1l3e9pLyY;License: Standard YouTube License, CC-BY
Hypothesis Testing - Difference of Two Means - Student's -Distribution & Normal Distribution; Author: The Organic Chemistry Tutor;https://www.youtube.com/watch?v=UcZwyzwWU7o;License: Standard Youtube License