
Videos
In Exercises 5–20, assume that the two samples are independent simple random samples selected from
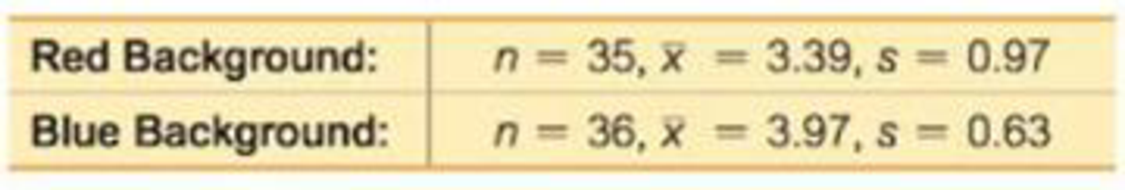
7. Color and Creativity Researchers from the University of British Columbia conducted trials to investigate the effects of color on creativity. Subjects with a red background were asked to think of creative uses for a brick; other subjects with a blue background were given the same task. Responses were scored by a panel of judges and results from scores of creativity are given below. Higher scores correspond to more creativity. The researchers make the claim that “blue enhances performance on a creative task.”
a. Use a 0.01 significance level to test the claim that blue enhances performance on a creative task.
b. Construct the confidence interval appropriate for the hypothesis test in part (a). What is it about the confidence interval that causes us to reach the same conclusion from part (a)?
Want to see the full answer?
Check out a sample textbook solution
Chapter 9 Solutions
Elementary Statistics - Excel Statistics Laboratory Manual
Additional Math Textbook Solutions
Developmental Mathematics (9th Edition)
Introductory Statistics
An Introduction to Mathematical Statistics and Its Applications (6th Edition)
Stats: Modeling the World Nasta Edition Grades 9-12
Elementary Statistics Using The Ti-83/84 Plus Calculator, Books A La Carte Edition (5th Edition)


- In Exercises 5–20, assume that the two samples are independent simple random samples selected from normally distributed populations, and do not assume that the population standard deviations are equal. (Note: Answers in Appendix D include technology answers based on Formula 9-1 along with “Table” answers based on Table A-3 with df equal to the smaller of n1 − 1 and n2 − 1.) IQ and Lead Exposure Data Set 7 “IQ and Lead” in Appendix B lists full IQ scores for a random sample of subjects with low lead levels in their blood and another random sample of subjects with high lead levels in their blood. The statistics are summarized below. a. Use a 0.05 significance level to test the claim that the mean IQ score of people with low blood lead levels is higher than the mean IQ score of people with high blood lead levels. b. Construct a confidence interval appropriate for the hypothesis test in part (a). c. Does exposure to lead appear to have an effect on IQ scores?arrow_forwardChapter 6, Section 4-HT, Exercise 212 Use the t-distribution and the given sample results to complete the test of the given hypotheses. Assume the results come from random samples, and if the sample sizes are small, assume the underlying distributions are relatively normal.Test H0 : μT=μC vs Ha : μT<μC using the fact that the treatment group (T) has a sample mean of 8.6 with a standard deviation of 4.1 while the control group (C) has a sample mean of 11.2with a standard deviation of 3.4. Both groups have 25 cases. (a) Give the test statistic and the p-value.Round your answer for the test statistic to two decimal places and your answer for the p-value to three decimal places.test statistic = p-value = (b) What is the conclusion of the test at a 5% significance level? Reject H0. Do not reject H0.arrow_forwardChapter 6, Section 5, Exercise 236 Use a t-distribution and the given matched pair sample results to complete the test of the given hypotheses. Assume the results come from random samples, and if the sample sizes are small, assume the underlying distribution of the differences is relatively normal. Assume that differences are computed using d=x1-x2.Test H0 : μd=0 vs Ha : μd≠0 using the paired difference sample results x¯d=10.51, sd=11.6, nd=25. Give the test statistic and the p-value.Round your answer for the test statistic to two decimal places and your answer for the p-value to three decimal places.test statistic = Enter your answer; test statisticp-value = Enter your answer; p-value Give the conclusion using a 5% significance level. Reject H0. Do not reject H0.arrow_forward
- In Exercises 9–12, refer to the sample data from the given exercises in Section 13–2 on page 611. Use the Wilcoxon signed-ranks test for the claim about the median of a population. Exercise 14 “Earthquake Depths”arrow_forwardIn Exercises 9–12, refer to the sample data from the given exercises in Section 13–2 on page 611. Use the Wilcoxon signed-ranks test for the claim about the median of a population. Exercise 13 “Earthquake Magnitudes”arrow_forwardChapter 5, Section 1, Exercise 009 The following is a set of hypotheses, some information from one or more samples, and a standard error from a randomization distribution.Test H0 : p=0.55 vs Ha : p≠0.55 when the sample has n=70, and p^=0.38 with SE=0.06.Find the value of the standardized z-test statistic.Round your answer to two decimal places.z= Enter your answer in accordance to the question statementarrow_forward
- A U.S. Food Survey showed that Americans routinely eat beef in their diet. Suppose that in a study of 49 consumers in Illinois and 64 consumers in Texas the following results were obtained from two samples regarding average yearly beef consumption: Illinois Texas = 49 = 64 = 54.1lb = 60.4lb S1 = 7.0 S2 = 8.0 Formulate a hypothesis so that, if the null hypothesis is rejected, we can conclude that the average amount of beef eaten annually by consumers in Illinois is significantly less than that eaten by consumers in Texas.arrow_forwardA kinesiologist claims that the resting heart rate of men aged 18 to 25 who exercise regularly is less than that of men who do not exercise regularly. Men in each category were selected at random and their resting heart rates were measured, with the following results: n Regular exercise 40 63 1.0 No regular exercise 30 71 1.2 (a) Set up the appropriate H0 and Ha. (b) Propose a formula to calculate the test statistic and report the result. (c) Find the P-value and make your conclusion on α = .05.arrow_forwardIn Exercises 9–12, refer to the sample data from the given exercises in Section 13–2 on page 611. Use the Wilcoxon signed-ranks test for the claim about the median of a population. Exercise 15 “Testing for Median Weight of Quarters”arrow_forward
- If all other values are held constant, what happens to the value of t when sample size increases ?arrow_forwardIn Exercises 11 –14, test the claim about the difference between two population means u1 and u2 at the level of significance a. Assume the samples are random and independent, and the populations are normally distributed.arrow_forwardA researcher studying public opinion of proposed Social Security changes obtains a simple random sample of 50adult Americans and asks them whether or not they support the proposed changes. To say that the distribution of the sample proportion of adults who respond yes, is approximately normal, how many more adult Americans does the researcher need to sample in the following cases? (a) 10% of all adult Americans support the changes (b) 15% of all adult Americans support the changesarrow_forward
 Big Ideas Math A Bridge To Success Algebra 1: Stu...AlgebraISBN:9781680331141Author:HOUGHTON MIFFLIN HARCOURTPublisher:Houghton Mifflin Harcourt