
ELEMENTARY SATISTICS IA
13th Edition
ISBN: 9780137695522
Author: Triola
Publisher: PEARSON C
expand_more
expand_more
format_list_bulleted
Videos
Textbook Question
Chapter 9, Problem 8CQQ
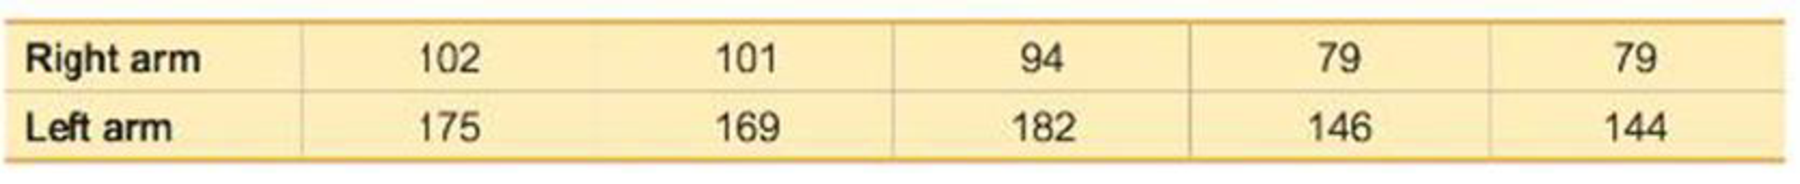
Dependent or Independent? Listed below are systolic blood pressure measurements (mm Hg) taken from the right and left arms of the same woman at different times (based on data from “Consistency of Blood Pressure Differences Between the Left and Right Arms,” by Eguchi et al., Archives of Internal Medicine, Vol. 167). Are the data dependent or independent?
Expert Solution & Answer
Want to see the full answer?
Check out a sample textbook solution
Students have asked these similar questions
To examine bivariate data graphically, the best choice is two side by side histograms? Define this statement?
How do you calculate the upper quartile when you have missing data in the column age in the dataset df?
a. quantile(df$age, .75)
b. quartile(df$age, .75, na.rm=T)
c. quartile(df$age, .75)
d. quantile(df$age, .75, na.rm=T)
I just need help with a thank you!
Chapter 9 Solutions
ELEMENTARY SATISTICS IA
Ch. 9.1 - Verifying Requirements In the largest clinical...Ch. 9.1 - Verifying Requirements In the largest clinical...Ch. 9.1 - Hypotheses and Conclusions Refer to the hypothesis...Ch. 9.1 - Using Confidence Intervals a. Assume that we want...Ch. 9.1 - Interpreting Displays. In Exercises 5 and 6, use...Ch. 9.1 - Treating Carpal Tunnel Syndrome Carpal tunnel...Ch. 9.1 - Testing Claims About Proportions. In Exercises...Ch. 9.1 - Accuracy of Fast Food Drive-Through Orders In a...Ch. 9.1 - Testing Claims About Proportions. In Exercises...Ch. 9.1 - Testing Claims About Proportions. In Exercises...
Ch. 9.1 - Testing Claims About Proportions. In Exercises...Ch. 9.1 - Testing Claims About Proportions. In Exercises...Ch. 9.1 - Testing Claims About Proportions. In Exercises...Ch. 9.1 - Testing Claims About Proportions. In Exercises...Ch. 9.1 - Testing Claims About Proportions. In Exercises...Ch. 9.1 - Prob. 16BSCCh. 9.1 - Testing Claims About Proportions. In Exercises...Ch. 9.1 - Testing Claims About Proportions. In Exercises...Ch. 9.1 - Testing Claims About Proportions. In Exercises...Ch. 9.1 - Testing Claims About Proportions. In Exercises...Ch. 9.1 - Testing Claims About Proportions. In Exercises...Ch. 9.1 - Testing Claims About Proportions. In Exercises...Ch. 9.1 - Prob. 23BBCh. 9.1 - Yawning and Fishers Exact Test In one segment of...Ch. 9.1 - Overlap of Confidence Intervals In the article On...Ch. 9.1 - Equivalence of Hypothesis Test and Confidence...Ch. 9.2 - Independent and Dependent Samples Which of the...Ch. 9.2 - Confidence Interval for Hemoglobin Large samples...Ch. 9.2 - Hypothesis Tests and Confidence Intervals for...Ch. 9.2 - Degrees of Freedom For Example 1 on page 431, we...Ch. 9.2 - In Exercises 520, assume that the two samples are...Ch. 9.2 - In Exercises 520, assume that the two samples are...Ch. 9.2 - In Exercises 520, assume that the two samples are...Ch. 9.2 - In Exercises 520, assume that the two samples are...Ch. 9.2 - In Exercises 520, assume that the two samples are...Ch. 9.2 - In Exercises 520, assume that the two samples are...Ch. 9.2 - In Exercises 520, assume that the two samples are...Ch. 9.2 - In Exercises 520, assume that the two samples are...Ch. 9.2 - In Exercises 520, assume that the two samples are...Ch. 9.2 - In Exercises 520, assume that the two samples are...Ch. 9.2 - In Exercises 520, assume that the two samples are...Ch. 9.2 - In Exercises 520, assume that the two samples are...Ch. 9.2 - In Exercises 520, assume that the two samples are...Ch. 9.2 - In Exercises 520, assume that the two samples are...Ch. 9.2 - In Exercises 520, assume that the two samples are...Ch. 9.2 - In Exercises 520, assume that the two samples are...Ch. 9.2 - Larger Data Sets. In Exercises 2124, use the...Ch. 9.2 - Larger Data Sets. In Exercises 2124, use the...Ch. 9.2 - Larger Data Sets. In Exercises 2124, use the...Ch. 9.2 - Larger Data Sets. In Exercises 2124, use the...Ch. 9.2 - Pooling Repeat Exercise 12 IQ and Lead by assuming...Ch. 9.2 - Degrees of Freedom In Exercise 20 Blanking Out on...Ch. 9.2 - No Variation in a Sample An experiment was...Ch. 9.3 - True? For the methods of this section, which of...Ch. 9.3 - Notation Listed below are body temperatures from...Ch. 9.3 - Units of Measure If the values listed in Exercise...Ch. 9.3 - Degrees of Freedom If we use the sample data in...Ch. 9.3 - In Exercises 516, use the listed paired sample...Ch. 9.3 - In Exercises 516, use the listed paired sample...Ch. 9.3 - In Exercises 516, use the listed paired sample...Ch. 9.3 - In Exercises 516, use the listed paired sample...Ch. 9.3 - In Exercises 516, use the listed paired sample...Ch. 9.3 - In Exercises 516, use the listed paired sample...Ch. 9.3 - Prob. 11BSCCh. 9.3 - Prob. 12BSCCh. 9.3 - In Exercises 516, use the listed paired sample...Ch. 9.3 - In Exercises 516, use the listed paired sample...Ch. 9.3 - In Exercises 516, use the listed paired sample...Ch. 9.3 - In Exercises 516, use the listed paired sample...Ch. 9.3 - Prob. 17BSCCh. 9.3 - Larger Data Sets. In Exercises 1724, use the...Ch. 9.3 - Larger Data Sets. In Exercises 1724, use the...Ch. 9.3 - Larger Data Sets. In Exercises 1724, use the...Ch. 9.3 - Larger Data Sets. In Exercises 1724, use the...Ch. 9.3 - Larger Data Sets. In Exercises 1724, use the...Ch. 9.3 - Prob. 23BSCCh. 9.3 - Prob. 24BSCCh. 9.3 - Body Temperatures Refer to Data Set 3 Body...Ch. 9.4 - F Test Statistic a. If s12 represents the larger...Ch. 9.4 - F Test if using the sample data in Data Set 1 Body...Ch. 9.4 - Testing Normality For the hypothesis test...Ch. 9.4 - Prob. 4BSCCh. 9.4 - In Exercises 516, test the given claim. 5. Color...Ch. 9.4 - In Exercises 516, test the given claim. 6. Color...Ch. 9.4 - In Exercises 516, test the given claim. 7. Testing...Ch. 9.4 - In Exercises 516, test the given claim. 8....Ch. 9.4 - In Exercises 516, test the given claim. 9. Coke...Ch. 9.4 - In Exercises 516, test the given claim. 10. IQ and...Ch. 9.4 - Prob. 11BSCCh. 9.4 - Prob. 12BSCCh. 9.4 - Prob. 13BSCCh. 9.4 - Prob. 14BSCCh. 9.4 - In Exercises 516, test the given claim. 15. Old...Ch. 9.4 - In Exercises 516, test the given claim. 16....Ch. 9.4 - Prob. 17BBCh. 9.4 - Prob. 18BBCh. 9.4 - Finding Lower Critical F Values For hypothesis...Ch. 9 - In Exercises 15, use the following survey results:...Ch. 9 - In Exercises 1-5, use the following survey...Ch. 9 - In Exercises 1-5, use the following survey...Ch. 9 - In Exercises 1-5, use the following survey...Ch. 9 - In Exercises 7-5, use the following survey...Ch. 9 - True? Determine whether the following statement is...Ch. 9 - True? When we collect random samples to test the...Ch. 9 - Dependent or Independent? Listed below are...Ch. 9 - Hypotheses Identify the null and alternative...Ch. 9 - Test Statistics Identify the test statistic that...Ch. 9 - Denomination Effect In the article The...Ch. 9 - Denomination Effect Construct the confidence...Ch. 9 - Heights Listed below are heights (cm) randomly...Ch. 9 - Heights Use a 0.01 significance level with the...Ch. 9 - Before /After Treatment Results Captopril is a...Ch. 9 - Eyewitness Accuracy of Police Does stress affect...Ch. 9 - Are Flights Cheaper When Scheduled Earlier? Listed...Ch. 9 - Variation of Heights Use the sample data given in...Ch. 9 - Family Heights. In Exercises 15, use the following...Ch. 9 - Scatterplot Construct a scatterplot of the...Ch. 9 - Family Heights. In Exercises 1-5, use the...Ch. 9 - Family Heights. In Exercises 1-5, use the...Ch. 9 - Assessing Normality Interpret the normal quantile...Ch. 9 - Braking Reaction Times: Histogram Listed below are...Ch. 9 - Braking Reaction Times: Normal? The accompanying...Ch. 9 - Braking Reaction Times: Boxplots Use the same data...Ch. 9 - In Exercises 5-20, assume that the two samples are...Ch. 9 - Braking Reaction Times: Confidence Intervals a....Ch. 9 - FROM DATA TO DECISION Critical Thinking: Did the...Ch. 9 - Critical Thinking: Did the NFL Rule Change Have...Ch. 9 - Critical Thinking: Did the NFL Rule Change Have...
Knowledge Booster


Learn more about
Need a deep-dive on the concept behind this application? Look no further. Learn more about this topic, statistics and related others by exploring similar questions and additional content below.Similar questions
- Parametric tests (such as t-tests or ANOVAs) differ from nonparametric tests (such as chi-square) primarily in terms of the assumptions they require and the data they use. Explain these differences.arrow_forwardWhat is the name of the test used?arrow_forwardindicator for gender (=1 if male, =0 if female). Your data set has 200 observations. donation = 1.57 + 0.12age + 0.08age? – 0.43 gender + 0.07(gender * age), R? = 0.33 (0.15)* (0.67) (0.11) (0.01) (0.06) donation = 1.59 (0.68) 0.46 gender, R² = 0.30 (0.17) 1. Assuming homoscedastic errors, test the hypothesis that age affects charitable donations at the 5% level. 2. Interpret the coefficient on gender interacted with age. 3. How would you test that the difference in giving between men and women is independent of age? If you can run the test, run it. If you cannot, explain what you need.arrow_forward
- Do you have enough good cholesterol?” High density lipoprotein (HDL) is sometimes called the “good cholesterol” because high values are associated with a reduced risk of heart disease. According to the American Heart Association, people over the age of 20 years should have at least 40 milligrams per deciliter (mg/dl) of HDL cholesterol. U.S. women aged 20 and over have a mean HDL of 55 mg/dl with a standard deviation of 15.5 mg/dl. Assume that the distribution is normal. A. What percent of women have low values of HDL (40 mg/dl or less?) B. HDL levels of 60mg/dl or higher are believed to protect people from heart disease. What percent of women have protective levels of HDL? C. Women with more than 40mg/dl but less than 60 mg/dl of HDL are in the intermediate range, neither very good or very bad. What proportion are in this category?arrow_forwardDr. Palmer found a small treatment effect. What can she do in improve her changes of finding a statistically significant result?arrow_forwardWhat does Cohen’s d measure? What are type I and type II errors and how are they related?arrow_forward
- A random sample of 50 CSCC students are surveyed to determine what percent of our students are first-generation college students. The results showed that 16 of the students identify as first-generation college students. show your work What is the sample proportion of first-generation college students at CSCC? Is this an example of a parameter or a statistic? Explain.arrow_forwardHow is my work? Should anything be changed? A researcher wanted to examine the effect of a new math study skills program on second graders. Fifteen students took the new study skills program for six weeks and then took a standardized math exam, which is known to have a population mean score of µ = 80. The scores on the exam for the 15 students (who took the study skills program) are reported below. Scores on the standardized math exam for the 15 students:78, 85, 83, 75, 81, 85, 84, 82, 78, 83, 78, 90, 85, 83, 81 Test to see whether the students who took the new study skills program have significantly higher test scores than the national average. Perform the appropriate test in SPSS using α = .05 a. State the null and alternative hypotheses below. Null hypothesis: H0: μ = 80. Alternative hypothesis: H1: μ > 80 b. What type of test should be run on the data (be specific with the exact name of the test)? For example, don’t just state “t test,” but the specific t-test used. One sample…arrow_forwardA retail store is considering adding a new product line to its inventory. The store wants to know whether the new product line will be popular with customers. To determine this, they take a random sample of customers and ask if they would be interested in buying the new product line. Of the 125 people they asked, 70 were interested in this new product line. The manager is interested in creating a 90 % confidence interval regarding the population parameter.arrow_forward
arrow_back_ios
SEE MORE QUESTIONS
arrow_forward_ios
Recommended textbooks for you
 MATLAB: An Introduction with ApplicationsStatisticsISBN:9781119256830Author:Amos GilatPublisher:John Wiley & Sons Inc
 Probability and Statistics for Engineering and th...StatisticsISBN:9781305251809Author:Jay L. DevorePublisher:Cengage Learning
 Statistics for The Behavioral Sciences (MindTap C...StatisticsISBN:9781305504912Author:Frederick J Gravetter, Larry B. WallnauPublisher:Cengage Learning
 Elementary Statistics: Picturing the World (7th E...StatisticsISBN:9780134683416Author:Ron Larson, Betsy FarberPublisher:PEARSON
 The Basic Practice of StatisticsStatisticsISBN:9781319042578Author:David S. Moore, William I. Notz, Michael A. FlignerPublisher:W. H. Freeman
 Introduction to the Practice of StatisticsStatisticsISBN:9781319013387Author:David S. Moore, George P. McCabe, Bruce A. CraigPublisher:W. H. Freeman
MATLAB: An Introduction with Applications
Statistics
ISBN:9781119256830
Author:Amos Gilat
Publisher:John Wiley & Sons Inc
Probability and Statistics for Engineering and th...
Statistics
ISBN:9781305251809
Author:Jay L. Devore
Publisher:Cengage Learning
Statistics for The Behavioral Sciences (MindTap C...
Statistics
ISBN:9781305504912
Author:Frederick J Gravetter, Larry B. Wallnau
Publisher:Cengage Learning
Elementary Statistics: Picturing the World (7th E...
Statistics
ISBN:9780134683416
Author:Ron Larson, Betsy Farber
Publisher:PEARSON
The Basic Practice of Statistics
Statistics
ISBN:9781319042578
Author:David S. Moore, William I. Notz, Michael A. Fligner
Publisher:W. H. Freeman
Introduction to the Practice of Statistics
Statistics
ISBN:9781319013387
Author:David S. Moore, George P. McCabe, Bruce A. Craig
Publisher:W. H. Freeman
Hypothesis Testing using Confidence Interval Approach; Author: BUM2413 Applied Statistics UMP;https://www.youtube.com/watch?v=Hq1l3e9pLyY;License: Standard YouTube License, CC-BY
Hypothesis Testing - Difference of Two Means - Student's -Distribution & Normal Distribution; Author: The Organic Chemistry Tutor;https://www.youtube.com/watch?v=UcZwyzwWU7o;License: Standard Youtube License