
Concept explainers
Videos
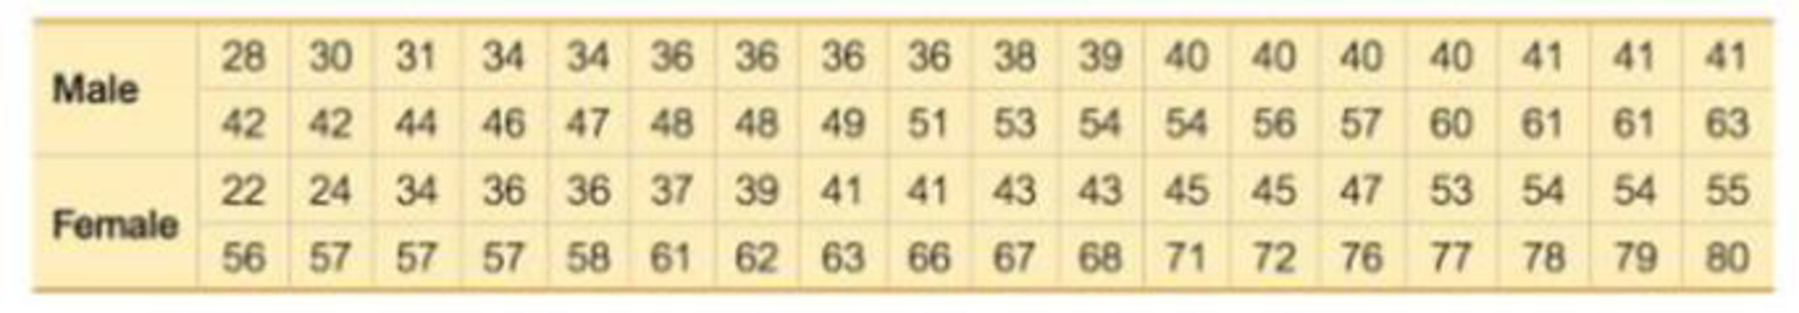
Braking Reaction Times: Boxplots Use the same data from Exercise 6 and use the same scale to construct a boxplot of the braking reaction times of males and another boxplot for the braking reaction times of females. What do the boxplots suggest?
6. Braking Reaction Times: Histogram Listed below are sorted braking reaction times (in 1/10,000 see) for male and female subjects (based on data from the RT-2S Brake Reaction Time Tester). Construct a histogram for the reaction times of males. Use a class width of 8 and use 28 as the lower limit of the first class. For the horizontal axis, use class midpoint values. Does it appear that the data are from a population with a
Want to see the full answer?
Check out a sample textbook solution
Chapter 9 Solutions
Essentials of Statistics Plus MyLab Statistics with Pearson eText -- Access Card Package (6th Edition) (What's New in Statistics)


 Glencoe Algebra 1, Student Edition, 9780079039897...AlgebraISBN:9780079039897Author:CarterPublisher:McGraw Hill
 Big Ideas Math A Bridge To Success Algebra 1: Stu...AlgebraISBN:9781680331141Author:HOUGHTON MIFFLIN HARCOURTPublisher:Houghton Mifflin Harcourt
 Holt Mcdougal Larson Pre-algebra: Student Edition...AlgebraISBN:9780547587776Author:HOLT MCDOUGALPublisher:HOLT MCDOUGAL