
STATISTICS F/BUS.+ECON.-18WK. MYSTATLAB
13th Edition
ISBN: 9780135901526
Author: MCCLAVE
Publisher: PEARSON
expand_more
expand_more
format_list_bulleted
Videos
Textbook Question
Chapter 9, Problem 9.97ACB
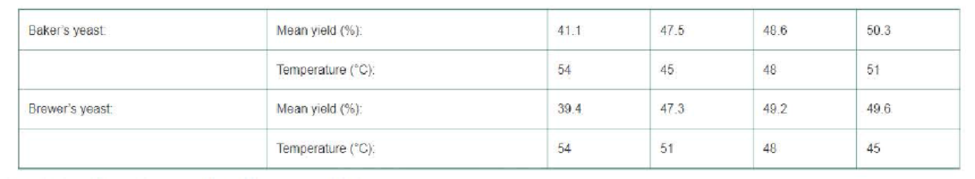
Baker’s vs. brewer’s yeast. The Electronic Journal of Biotechnology (Dec. 15, 2003) published an article on a comparison of two yeast extracts, baker’s yeast and brewer’s yeast. Brewer’s yeast is a surplus by-product obtained from a brewery, hence it is less expensive than primary-grown baker’s yeast. Samples of both yeast extracts were prepared at four different temperatures (45, 48, 51, and 54.C); thus, a 2 × 4 factorial design with yeast extract at two levels and temperature at four levels was employed. The response variable was the autolysis yield (recorded as a percentage).
- a. How many treatments are included in the experiment?
- b. An ANOVA found sufficient evidence of factor interaction at α = .05. Interpret this result practically.
- c. Give the null and alternative hypotheses for testing the main effects of yeast extract and temperature.
- d. Explain why the tests, part c, should not be conducted.
- e. Multiple comparisons of the four temperature
means were conducted for each of the two yeast extracts. Interpret the results shown below.
Expert Solution & Answer
Want to see the full answer?
Check out a sample textbook solution
Students have asked these similar questions
Red Wine and Weight LossResveratrol, a compound in grapes and red wine, has been shown to promote weight loss in rodents and now in a primate.1 Lemurs fed a resveratrol supplement for four weeks had decreased food intake, increased metabolic rate, and a reduction in seasonal body-mass gain compared to a control group. Suppose a hypothetical study is done for a different primate species, with one group given a resveratrol supplement and the other group given a placebo. We wish to see if there is evidence that resveratrol increases the mean metabolism rate for this species. (This exercise presents hypothetical data. We will see the results from the actual study later in this chapter.)
(a) State the null and alternative hypotheses.Let group 1 be the species taking a resveratrol supplement and let group 2 be the species taking a placebo.
In a study conducted in the Science Department of Faculty of Science, Technology and Human Development in a University; the researcher examined the influence of the drug succinylcholine on the circulation levels of androgens in the blood. Blood samples from wild, free-ranging deer were obtained via the jugular vein immediately after an intramuscular injection of succinylcholine using darts and a capture gun. Deer were bled again approximately 30 minutes after the injection and then released. The level of androgens at time of capture and 30 minutes later, measured in nanograms per milliliter (ng/ml), for 15 deers as in Table Q1.
Assuming that the populations of androgen at time of injection and 30 minutes later are normally distributed:i) Find the average and standard deviation of this studyii)Determine the critical region of this problem.iii) Test at the 0.05 level of significance whether the androgen concentrations are altered after 30 minutes of restraint.
Suppose a researcher is interested inthe effectiveness in a new childhood exercise program implemented in a SRS of schools across a particular county. In order to test the hypothesis that the new program decreases BMI (Kg/m2), the researcher takes a SRS of children from schools where the program is employed and a SRS from schools that do not employ the program and compares the results. Assume the following table represents the SRSs of students and their BMIs.
Student intervention group
BMI (kg/m2)
Student control group
BMI (kg/m2)
A
18.6
A
21.6
B
18.2
B
18.9
C
19.5
C
19.4
D
18.9
D
22.6
E
24.1
F
23.6
A) Assuming that all the necessary conditions are met (normality, independence, etc.) carry out the appropriate statistical test to determine if the new exercise program is effective. Use an alpha level of 0.05. Do not assume equal variances.B) Construct a 95% confidence interval about your estimate for the average difference in BMI between the groups.
Chapter 9 Solutions
STATISTICS F/BUS.+ECON.-18WK. MYSTATLAB
Ch. 9.1 - What are the treatments for a designed experiment...Ch. 9.1 - What are the treatments for a designed experiment...Ch. 9.1 - What is the difference between an observational...Ch. 9.1 - What are the experimental units on which each of...Ch. 9.1 - Identifying the type of experiment. Brief...Ch. 9.1 - Drafting NFL quarterbacks. Refer to the Journal of...Ch. 9.1 - Corporate sustainability and firm characteristics....Ch. 9.1 - Prob. 9.8ACBCh. 9.1 - Can money spent on gifts buy love? Refer to the...Ch. 9.1 - Value perceptions of consumers. Refer to the...
Ch. 9.1 - Value perceptions of consumers (contd). Refer to...Ch. 9.1 - Reducing stress in livestock transported to...Ch. 9.1 - Mixed gender decision-making groups. In business,...Ch. 9.1 - Testing a new pain-reliever tablet. Paracetamol is...Ch. 9.2 - Use Tables V, VI, VII, and VIII in Appendix D to...Ch. 9.2 - Find the following probabilities: a. P (F 3.48)...Ch. 9.2 - Consider dot plots 1 and 2 shown below. Assume...Ch. 9.2 - Refer to Exercise 9.17. Conduct a two-sample...Ch. 9.2 - Refer to Exercises 9.17 and 9.18. Complete the...Ch. 9.2 - A partially completed ANOVA table for a completely...Ch. 9.2 - The data in the next table resulted from an...Ch. 9.2 - Prob. 9.22ACBCh. 9.2 - Prob. 9.23ACBCh. 9.2 - Prob. 9.24ACBCh. 9.2 - Prob. 9.25ACBCh. 9.2 - Making high-stakes insurance decisions. The...Ch. 9.2 - Contingent valuation of homes in contaminated...Ch. 9.2 - Study of recall of TV commercials. Do TV shows...Ch. 9.2 - Do the media influence your attitude toward...Ch. 9.2 - Homework assistance for accounting students. Refer...Ch. 9.2 - Prob. 9.31ACICh. 9.2 - Is honey a cough remedy? Pediatric researchers...Ch. 9.2 - Prob. 9.33ACICh. 9.2 - Banning controversial sports team sponsors....Ch. 9.3 - Consider a completely randomized design with k...Ch. 9.3 - Prob. 9.36LMCh. 9.3 - Prob. 9.37LMCh. 9.3 - Prob. 9.38LMCh. 9.3 - Prob. 9.39LMCh. 9.3 - Prob. 9.40ACBCh. 9.3 - Evaluation of flexography printing plates. Refer...Ch. 9.3 - Guilt in decision making. The effect of guilt...Ch. 9.3 - Prob. 9.43ACBCh. 9.3 - Prob. 9.44ACBCh. 9.3 - Prob. 9.45ACICh. 9.3 - Study of recall of TV commercials. Refer to the...Ch. 9.3 - Prob. 9.47ACICh. 9.3 - Prob. 9.48ACICh. 9.3 - Prob. 9.49ACICh. 9.4 - A randomized block design yielded the following...Ch. 9.4 - Prob. 9.51LMCh. 9.4 - A randomized block design was used to compare the...Ch. 9.4 - Prob. 9.53LMCh. 9.4 - Prob. 9.54ACBCh. 9.4 - Peer mentor training at a firm. Peer mentoring...Ch. 9.4 - Prob. 9.56ACBCh. 9.4 - Interactive video games and physical fitness. Wii...Ch. 9.4 - Prob. 9.58ACBCh. 9.4 - A new method of evaluating health care research...Ch. 9.4 - Prob. 9.60ACICh. 9.4 - Prob. 9.61ACICh. 9.4 - Stress in cows prior to slaughter. What is the...Ch. 9.4 - Anticorrosive behavior of steel coated with epoxy....Ch. 9.5 - Suppose you conduct a 4 3 factorial experiment....Ch. 9.5 - Prob. 9.65LMCh. 9.5 - The partially complete ANOVA table given next is...Ch. 9.5 - Prob. 9.67LMCh. 9.5 - The next table gives data for a 2 2 factorial...Ch. 9.5 - Suppose a 3 3 factorial experiment is conducted...Ch. 9.5 - Dynamics of the buyer-seller relationship. An...Ch. 9.5 - Prob. 9.71ACBCh. 9.5 - Prob. 9.72ACBCh. 9.5 - Prob. 9.73ACBCh. 9.5 - Prob. 9.74ACBCh. 9.5 - Temptation in consumer choice. Are you willing to...Ch. 9.5 - Commercial eggs produced from different housing...Ch. 9.5 - Prob. 9.77ACICh. 9.5 - Eyewitnesses and mugshots. Criminologists...Ch. 9.5 - Impact of flavor name on consumer choice. Do...Ch. 9 - What is the difference between a one-way ANOVA and...Ch. 9 - Explain the difference between an experiment that...Ch. 9 - What are the treatments in a two-factor...Ch. 9 - Why does the experimentwise error rate of a...Ch. 9 - A completely randomized design is used to compare...Ch. 9 - An experiment employing a randomized block design...Ch. 9 - The following table shows a partially completed...Ch. 9 - Prob. 9.89ACBCh. 9 - Prob. 9.90ACBCh. 9 - Impact of paper color on exam scores. A study...Ch. 9 - Study of mutual fund performance. Mutual funds are...Ch. 9 - Study of mutual fund performance. Refer to...Ch. 9 - Prob. 9.94ACBCh. 9 - Prob. 9.95ACBCh. 9 - Prob. 9.96ACBCh. 9 - Bakers vs. brewers yeast. The Electronic Journal...Ch. 9 - A managerial decision problem. A direct-mail...Ch. 9 - Ethics of downsizing. A major strategic...Ch. 9 - Absentee rates at a jeans plant. A plant that...Ch. 9 - Effectiveness of sales closing techniques....Ch. 9 - Prob. 9.103ACICh. 9 - Prob. 9.104ACICh. 9 - Managers trust and job-related tension. Research...Ch. 9 - Testing the effectiveness of supermarket sales...Ch. 9 - Prob. 9.107ACICh. 9 - Prob. 9.108ACICh. 9 - Pollutants at a housing development. Polycyclic...Ch. 9 - Explain why both of the situations n Activity 8.1...
Knowledge Booster


Learn more about
Need a deep-dive on the concept behind this application? Look no further. Learn more about this topic, statistics and related others by exploring similar questions and additional content below.Similar questions
- The article “Effects of Diets with Whole Plant-Origin Proteins Added with Different Ratiosof Taurine:Methionine on the Growth, Macrophage Activity and Antioxidant Capacity ofRainbow Trout (Oncorhynchus mykiss) Fingerlings” (O. Hernandez, L. Hernandez, et al.,Veterinary and Animal Science, 2017:4-9) reports that a sample of 210 juvenile rainbowtrout fed a diet fortified with equal amounts of the amino acids taurine and methionine for aperiod of 70 days had a mean weight gain of 313 percent with a standard deviation of 25, while 210 fish fed with a control diet had a mean weight gain of 233 percent with a standard deviation of 19. Units are percent. Find a 99% confidence interval for the difference in weight gain on the two diets.arrow_forwardAn automotive engineer is investigating two different types of metering devices for an electronic fuel injection system to determine whether they differ in their fuel mileage performance. The system is installed on 10 different cars, and a test is run with each metering device on each car. The data is provided below: Metering Device Car 1 2 1 17.6 16.8 2 19.4 20.0 3 18.2 17.6 4 17.1 16.4 5 15.3 16.0 6 15.9 15.9 7 16.3 16.5 8 18.0 18.4 9 17.3 16.4 10 19.1 20.1 Is there a significant difference between the means of the two metering devices? Use . Interpret the result in the context of the problem. An article in the journal Hazardous Waste and Hazardous Materials (Vol. 6, 1989) reported the results of an analysis of the weight of calcium in standard cement and cement doped with lead. Reduced levels of calcium would indicate that the hydration mechanism in the cement is blocked…arrow_forwardThe authors of the article "Adjuvant Radiotherapy and Chemotherapy in Node-Positive Premenopausal Women with Breast Cancer"† reported on the results of an experiment designed to compare treating cancer patients with chemotherapy only to treatment with a combination of chemotherapy and radiation. Of the 154 individuals who received the chemotherapy-only treatment, 76 survived at least 15 years, whereas 98 of the 164 patients who received the hybrid treatment survived at least that long. With p1 denoting the proportion of all such women who, when treated with just chemotherapy, survive at least 15 years and p2 denoting the analogous proportion for the hybrid treatment, p̂1 = (rounded to three decimal places) and p̂2 = (rounded to three decimal places). A confidence interval for the difference between proportions based on the traditional formula with a confidence level of approximately 99% is 0.494 − 0.598 ± (2.58) (0.494)(0.506) 154 + (0.598)(0.402) 164…arrow_forward
- An experiment to determine if a migraine medication decreases a person's average number of monthly migraines is performed on 400 people who report they have several migraines a month. Researchers randomly assigned 200 people to the treatment group and 200 people to the control group. After the study, the researchers determined that 48 of the subjects in the treatment group and 28 of the subjects in the control group average fewer migraines per month. The data from the two groups are resampled 150 times, and the table shows the distribution of the differences of the proportions for the reconfigured treatment and control groups.arrow_forwardA suburban hotel derives its revenue from its hotel and restaurant operations. Theowners are interested in the relationship between the number of rooms occupied on anightly basis and the revenue per day in the restaurant. Below is a sample of 25 days(Monday through Thursday) from last year showing the restaurant income and numberof rooms occupied.arrow_forwardIn its January 25, 2012, issue, the Journal of the American Medical Association reported on the effects of overconsumption of low, normal, and high protein diets on weight gain, energy expenditure, and body composition. Researchers conducted a single blind, randomized controlled trial of 25 U.S. adults. The subjects were healthy, weight-stable, male and female volunteers, aged 18 to 35 years. All subjects consumed a weight-stabilizing diet for 13 to 25 days. Afterwards, the researchers randomly assigned participants to diets containing various percentages of energy from protein: 5% (low protein), 15% (normal protein), or 25% (high protein). The subjects were not aware of the specific protein level diet to which they were assigned. On these diets the researchers overfed the participants during the last 8 weeks of their 10 to 12 week stay in the inpatient metabolic unit. The goal was to investigate the effect of overconsumption of protein on weight gain, energy expenditure, and body…arrow_forward
- We have a sample of 2,400 geriatric patients who are in an assisted living home, of which 1,200 participated in a new preventative Drug A. Rates of UTIs tend to be higher than average among this population. As part of a preventative and treatment intervention, we are examining the performance of several drugs: Preventative Drug (before the onset of UTI) Drug A: preventative UTI drug taken daily in hopes to prevent the growth of bacteria that causes UTIs Treatment Drugs (after the onset of UTI) Drug B: New antibiotic for treating UTIs Drug C: Conventional antibiotic for treating UTIs Information for how many patients took each drug or combination of drugs is summarized below in the two tables. Use these to answer questions a) -d) Table 1. Summary of performance of drug A: UTI rates among those taking and not taking drug A Did not take Drug A Did take Drug A Total UTI 759 887 1646 No UTI 441 312 753 Total 1200 1200 2400 Table 2. Summary of performance of drug B and C: recovery…arrow_forwardA low-level CDC bureaucrat wants to please his boss by gathering evidence thatthe current government-mandated shutdown of society is not causing people’s mentalhealth to deteriorate, so that it can safely be continued for several years if anyexpert says it’s necessary.He polls a random sample of 1600 citizens, gathering data on such items asincome loss, weight gain, access to toilet paper, hours spent binge-watchingNetflix, and number of injuries caused by household fights, and compiles all thisinto a scientifically-weighted “misery index”.The mean misery index from the sample is 99.2; it seems reasonable to use apopulation standard deviation σ = 19.1.a) Does this information provide significant evidence (at the 5% level) that thenationwide mean misery index is less than 100? Set up appropriate null andalternative hypotheses, calculate the appropriate test statistic, find the P-value,and state your conclusion. (10)b) A CDC press release publishing the results of this study claims that…arrow_forwardA low-level CDC bureaucrat wants to please his boss by gathering evidence thatthe current government-mandated shutdown of society is not causing people’s mentalhealth to deteriorate, so that it can safely be continued for several years if anyexpert says it’s necessary.He polls a random sample of 1600 citizens, gathering data on such items asincome loss, weight gain, access to toilet paper, hours spent binge-watchingNetflix, and number of injuries caused by household fights, and compiles all thisinto a scientifically-weighted “misery index”.The mean misery index from the sample is 99.2; it seems reasonable to use apopulation standard deviation σ = 19.1.a) Does this information provide significant evidence (at the 5% level) that thenationwide mean misery index is less than 100? Set up appropriate null andalternative hypotheses, calculate the appropriate test statistic, find the P-value,and state your conclusion. b) A CDC press release publishing the results of this study claims that…arrow_forward
- 2.Researchers studied selenium levels in beef raised in a low selenium region of the United States. The goal of the study was to compare selenium levels in the region-raised beef to selenium levels in cooked venison, squirrel, and beef from other regions of the United States. The data in the Excel file (se_level.xlsx or se_level.txt) are the selenium levels calculated on a dry weight basis in mg=100 g for a sample of 53 region-raised cattle 11.23 29.63 20.42 10.12 39.91 32.66 38.38 36.21 16.39 27.44 17.29 56.20 28.94 20.11 25.35 21.77 31.62 32.63 30.31 46.16 56.61 24.47 29.39 40.71 18.52 27.80 19.49 15.82 27.74 22.35 34.78 35.09 32.60 37.03 27.00 44.20 13.09 33.03 9.69 32.45 37.38 34.91 27.99 22.36 22.68 26.52 46.01 38.04 30.88 30.04 25.91 18.54 25.51 Please answer the following questions: Use these data to construct: A…arrow_forward2.Researchers studied selenium levels in beef raised in a low selenium region of the United States. The goal of the study was to compare selenium levels in the region-raised beef to selenium levels in cooked venison, squirrel, and beef from other regions of the United States. The data in the Excel file (se_level.xlsx or se_level.txt) are the selenium levels calculated on a dry weight basis in mg=100 g for a sample of 53 region-raised cattle 11.23 29.63 20.42 10.12 39.91 32.66 38.38 36.21 16.39 27.44 17.29 56.20 28.94 20.11 25.35 21.77 31.62 32.63 30.31 46.16 56.61 24.47 29.39 40.71 18.52 27.80 19.49 15.82 27.74 22.35 34.78 35.09 32.60 37.03 27.00 44.20 13.09 33.03 9.69 32.45 37.38 34.91 27.99 22.36 22.68 26.52 46.01 38.04 30.88 30.04 25.91 18.54 25.51 Please answer the following questions: Describe these data with…arrow_forwardA large manufacturing company investigated the service it received from its suppliers and discovered that, in the past, 38% of all material shipments were received late. However, the company recently installed a just-in-time system in which suppliers are linked more closely to the manufacturing process. A random sample of 150 deliveries since the just-in-time system was installed reveals that 33 deliveries were late. If we want to test whether the proportion of late deliveries was reduced signicantly at = 0:10 the null and alternative hypotheses are a. Null hypothesis (H0) b. Alternative hypothesis (HA)arrow_forward
arrow_back_ios
SEE MORE QUESTIONS
arrow_forward_ios
Recommended textbooks for you
 MATLAB: An Introduction with ApplicationsStatisticsISBN:9781119256830Author:Amos GilatPublisher:John Wiley & Sons Inc
 Probability and Statistics for Engineering and th...StatisticsISBN:9781305251809Author:Jay L. DevorePublisher:Cengage Learning
 Statistics for The Behavioral Sciences (MindTap C...StatisticsISBN:9781305504912Author:Frederick J Gravetter, Larry B. WallnauPublisher:Cengage Learning
 Elementary Statistics: Picturing the World (7th E...StatisticsISBN:9780134683416Author:Ron Larson, Betsy FarberPublisher:PEARSON
 The Basic Practice of StatisticsStatisticsISBN:9781319042578Author:David S. Moore, William I. Notz, Michael A. FlignerPublisher:W. H. Freeman
 Introduction to the Practice of StatisticsStatisticsISBN:9781319013387Author:David S. Moore, George P. McCabe, Bruce A. CraigPublisher:W. H. Freeman
MATLAB: An Introduction with Applications
Statistics
ISBN:9781119256830
Author:Amos Gilat
Publisher:John Wiley & Sons Inc
Probability and Statistics for Engineering and th...
Statistics
ISBN:9781305251809
Author:Jay L. Devore
Publisher:Cengage Learning
Statistics for The Behavioral Sciences (MindTap C...
Statistics
ISBN:9781305504912
Author:Frederick J Gravetter, Larry B. Wallnau
Publisher:Cengage Learning
Elementary Statistics: Picturing the World (7th E...
Statistics
ISBN:9780134683416
Author:Ron Larson, Betsy Farber
Publisher:PEARSON
The Basic Practice of Statistics
Statistics
ISBN:9781319042578
Author:David S. Moore, William I. Notz, Michael A. Fligner
Publisher:W. H. Freeman
Introduction to the Practice of Statistics
Statistics
ISBN:9781319013387
Author:David S. Moore, George P. McCabe, Bruce A. Craig
Publisher:W. H. Freeman
Introduction to experimental design and analysis of variance (ANOVA); Author: Dr. Bharatendra Rai;https://www.youtube.com/watch?v=vSFo1MwLoxU;License: Standard YouTube License, CC-BY