
Elementary Statistics: A Step By Step Approach
10th Edition
ISBN: 9781259755330
Author: Allan G. Bluman
Publisher: McGraw-Hill Education
expand_more
expand_more
format_list_bulleted
Concept explainers
Videos
Textbook Question
Chapter 9.1, Problem 16E
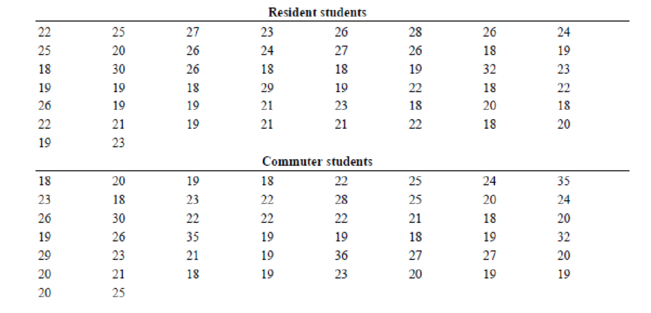
Ages of College Students The dean of students wants to see whether there is a significant difference in ages of resident students and commuting students. She selects a random sample of 50 students from each group. The ages are shown here. At α = 0.05, decide if there is enough evidence to reject the claim of no difference in the ages of the two groups. Use the P-value method. Assume σ1 = 3.68 and σ2 = 4.7.
Expert Solution & Answer
Want to see the full answer?
Check out a sample textbook solution
Students have asked these similar questions
Victims of Violence A random survey of 79 women who were victims of violence found that 20 were attacked by relatives. A random survey of 58 men found that 5 were attacked by relatives. At α=0.10, can it be shown that the percentage of women who were attacked by relatives is greater than the percentage of men who were attacked by relatives? Use p1 for the proportion of women who were attacked by relatives. Use the P-value method with tables. State the hypothesis and identify the claim with the correct hypothesis.
H0: ▼(Choose one)
H1: ▼(Choose one)
This hypothesis test is a ▼(Choose one) test.
Compute the test value. Round the answer to at least 3 decimal places, if necessary.
z=
Find the P -value. Round the answer to four decimal places.
P-value=
Make the decision.
What's the null hypothesis?
Summarize the results.
There is ▼(Choose one) that the proportion of women who were attacked by relatives is greater than the proportion of men who were…
Victims of Violence A random survey of 86 women who were victims of violence found that 20 were attacked by relatives. A random survey of 54 men found that 6 were attacked by relatives. At α=0.10, can it be shown that the percentage of women who were attacked by relatives is different from the percentage of men who were attacked by relatives? Use p1 for the proportion of women who were attacked by relatives. Use the P-value method with tables.
State the hypotheses and identify the claim with the correct hypothesis.
H0: claim/do not claim?
H1: claim/do not claim?
This hypothesis test is one tailed/two tailed?
Compute the test value. Round all intermediate steps to four decimal places and always round z score values to tow decimal places. Z=
Compute the P-value. Round the answer to four decimal places.
P -value =
Make the decision.
Reject/do not reject the null hypothesis.
Summarize the results.
There is/ is not enough evidence to support the claim t
Victims of Violence A random survey of 74 women who were victims of violence found that 30 were attacked by relatives. A random survey of 45 men found that 18 were attacked by relatives. At α=0.10 , can it be shown that the percentage of women who were attacked by relatives is greater than the percentage of men who were attacked by relatives? Use p1 for the proportion of women who were attacked by relatives. Use the P-value method with tables.
(a) State the hypotheses and identify the claim.
H0: claim/ not claim
H1: claim/not claim
This hypothesis test is a one-tailed test.
(b) Find the critical value(s). Round the answer(s) to at least three decimal places. If there is more than one critical value, separate them with commas.
Critical value(s):
(c) Compute the test value. Round the answer to at least three decimal places.
t=
(d) Make the decision.
Reject/ do not reject the null hypothesis.
(e) Summarize the results.
There is/is not enough evidence to reject the null hypothesis.
Chapter 9 Solutions
Elementary Statistics: A Step By Step Approach
Ch. 9.1 - Home Runs For a sports radio talk show, you are...Ch. 9.1 - Explain the difference between testing a single...Ch. 9.1 - When a researcher selects all possible pairs of...Ch. 9.1 - What three assumptions must be met when you are...Ch. 9.1 - Show two different ways to state that the means of...Ch. 9.1 - For Exercises 5 through 16, perform each of the...Ch. 9.1 - For Exercises 5 through 16, perform each of the...Ch. 9.1 - For Exercises 5 through 16, perform each of the...Ch. 9.1 - For Exercises 5 through 16, perform each of the...Ch. 9.1 - For Exercises 5 through 16, perform each of the...
Ch. 9.1 - For Exercises 5 through 16, perform each of the...Ch. 9.1 - For Exercises 5 through 16, perform each of the...Ch. 9.1 - For Exercises 5 through 16, perform each of the...Ch. 9.1 - Prob. 13ECh. 9.1 - For Exercises 5 through 16, perform each of the...Ch. 9.1 - Self-Esteem Scores In a study of a group of women...Ch. 9.1 - Ages of College Students The dean of students...Ch. 9.1 - Working Breath Rate Two random samples of 32...Ch. 9.1 - Traveling Distances Find the 95% confidence...Ch. 9.1 - Prob. 19ECh. 9.1 - Prob. 20ECh. 9.1 - Television Watching The average number of hours of...Ch. 9.1 - For Exercises 5 through 16, perform each of the...Ch. 9.1 - Prob. 23ECh. 9.1 - Home Prices According to the almanac, the average...Ch. 9.1 - Exam Scores at Private and Public Schools A...Ch. 9.1 - Sale Prices for Houses The average sales price of...Ch. 9.1 - Average Earnings for College Graduates The average...Ch. 9.2 - Too Long on the Telephone A company collects data...Ch. 9.2 - For these exercises, perform each of these steps....Ch. 9.2 - For these exercises, perform each of these steps....Ch. 9.2 - Prob. 3ECh. 9.2 - Prob. 4ECh. 9.2 - For these exercises, perform each of these steps....Ch. 9.2 - For these exercises, perform each of these steps....Ch. 9.2 - For these exercises, perform each of these steps....Ch. 9.2 - For these exercises, perform each of these steps....Ch. 9.2 - Prob. 9ECh. 9.2 - Find the 95% confidence interval for the...Ch. 9.2 - Prob. 11ECh. 9.2 - Prob. 12ECh. 9.2 - Prob. 13ECh. 9.2 - Prob. 14ECh. 9.2 - Prob. 15ECh. 9.2 - Ages of Homes Whiting, Indiana, leads the Top 100...Ch. 9.2 - Prob. 17ECh. 9.2 - Out-of-State Tuitions The out-of-state tuitions...Ch. 9.2 - Gasoline Prices A random sample of monthly...Ch. 9.2 - For these exercises, perform each of these steps....Ch. 9.2 - Prob. 21ECh. 9.2 - Prob. 22ECh. 9.3 - Air Quality As a researcher for the EPA, you have...Ch. 9.3 - Classify each as independent or dependent samples....Ch. 9.3 - For Exercises 2 through 12, perform each of these...Ch. 9.3 - For Exercises 2 through 12, perform each of these...Ch. 9.3 - For Exercises 2 through 12, perform each of these...Ch. 9.3 - For Exercises 2 through 12, perform each of these...Ch. 9.3 - For Exercises 2 through 12, perform each of these...Ch. 9.3 - For Exercises 2 through 12, perform each of these...Ch. 9.3 - For Exercises 2 through 12, perform each of these...Ch. 9.3 - For Exercises 2 through 12, perform each of these...Ch. 9.3 - Toy Assembly Test An educational researcher...Ch. 9.3 - For Exercises 2 through 12, perform each of these...Ch. 9.3 - For Exercises 2 through 12, perform each of these...Ch. 9.3 - Prob. 13ECCh. 9.4 - Smoking and Education You are researching the...Ch. 9.4 - Prob. 1ECh. 9.4 - Find p and q for each. a. n = 36, X = 20 b. n =...Ch. 9.4 - Prob. 3ECh. 9.4 - Find each X, given p. a. p = 0.24, n = 300 b. p =...Ch. 9.4 - Prob. 5ECh. 9.4 - Find p and q. a. X1 = 6, n1 = 15, X2 = 9, n2 = 15...Ch. 9.4 - For Exercises 7 through 27, perform these steps....Ch. 9.4 - Leisure Time In a sample of 150 men, 132 said that...Ch. 9.4 - Prob. 9ECh. 9.4 - For Exercises 7 through 27, perform each of these...Ch. 9.4 - Prob. 11ECh. 9.4 - For Exercises 7 through 27, perform each of these...Ch. 9.4 - Prob. 13ECh. 9.4 - For Exercises 7 through 27, perform each of these...Ch. 9.4 - Prob. 15ECh. 9.4 - Smoking Survey National statistics show that 23%...Ch. 9.4 - For Exercises 7 through 27, perform each of these...Ch. 9.4 - For Exercises 7 through 27, perform each of these...Ch. 9.4 - Prob. 19ECh. 9.4 - For Exercises 7 through 27, perform these steps....Ch. 9.4 - For Exercises 7 through 27, perform these steps....Ch. 9.4 - For Exercises 7 through 27, perform these steps....Ch. 9.4 - For Exercises 7 through 27, perform these steps....Ch. 9.4 - For Exercises 7 through 27, perform these steps....Ch. 9.4 - For Exercises 7 through 27, perform these steps....Ch. 9.4 - For Exercises 7 through 27, perform these steps....Ch. 9.4 - For Exercises 7 through 27, perform these steps....Ch. 9.4 - Prob. 28ECCh. 9.5 - Automatic Transmissions Assume the following data...Ch. 9.5 - When one is computing the F test value, what...Ch. 9.5 - Why is the critical region always on the right...Ch. 9.5 - What are the two different degrees of freedom...Ch. 9.5 - What are the characteristics of the F...Ch. 9.5 - Prob. 5ECh. 9.5 - Using Table H, find the critical value for each....Ch. 9.5 - Prob. 7ECh. 9.5 - Using Table H, find the P-value interval for each...Ch. 9.5 - Prob. 9ECh. 9.5 - For Exercises 9 through 24, perform the following...Ch. 9.5 - For Exercises 9 through 24, perform the following...Ch. 9.5 - For Exercises 9 through 24, perform the following...Ch. 9.5 - Prob. 13ECh. 9.5 - For Exercises 9 through 24, perform the following...Ch. 9.5 - For Exercises 9 through 24, perform the following...Ch. 9.5 - For Exercises 9 through 24, perform the following...Ch. 9.5 - Prob. 17ECh. 9.5 - For Exercises 9 through 24, perform the following...Ch. 9.5 - For Exercises 9 through 24, perform the following...Ch. 9.5 - For Exercises 9 through 24, perform the following...Ch. 9.5 - Prob. 21ECh. 9.5 - For Exercises 9 through 24, perform the following...Ch. 9.5 - For Exercises 9 through 24, perform the following...Ch. 9.5 - For Exercises 9 through 24, perform the following...Ch. 9 - For each exercise, perform these steps. Assume...Ch. 9 - Prob. 9.1.2RECh. 9 - Prob. 9.2.3RECh. 9 - Prob. 9.2.4RECh. 9 - For each exercise, perform these steps. Assume...Ch. 9 - For each exercise, perform these steps. Assume...Ch. 9 - High and Low Temperatures March is a month of...Ch. 9 - Testing After Review A statistics class was given...Ch. 9 - Lay Teachers in Religious Schools A study found a...Ch. 9 - Prob. 9.4.10RECh. 9 - Prob. 9.5.11RECh. 9 - Heights of World Famous Cathedrals The heights (in...Ch. 9 - Prob. 9.5.13RECh. 9 - Prob. 1DACh. 9 - Prob. 2DACh. 9 - Prob. 3DACh. 9 - Prob. 4DACh. 9 - Prob. 5DACh. 9 - Prob. 1CQCh. 9 - Prob. 2CQCh. 9 - Prob. 3CQCh. 9 - Prob. 4CQCh. 9 - Prob. 5CQCh. 9 - To test the equality of two proportions, you would...Ch. 9 - Prob. 7CQCh. 9 - Prob. 8CQCh. 9 - Complete these statements with the best answer. 9....Ch. 9 - Prob. 10CQCh. 9 - Prob. 11CQCh. 9 - Prob. 12CQCh. 9 - Prob. 13CQCh. 9 - Prob. 14CQCh. 9 - Prob. 15CQCh. 9 - Prob. 16CQCh. 9 - For these exercises, perform each of these steps....Ch. 9 - Prob. 18CQCh. 9 - Prob. 19CQCh. 9 - Mathematical Skills In an effort to improve the...Ch. 9 - Prob. 21CQCh. 9 - Prob. 22CQCh. 9 - Prob. 23CQCh. 9 - Prob. 24CQCh. 9 - Prob. 25CQ
Knowledge Booster


Learn more about
Need a deep-dive on the concept behind this application? Look no further. Learn more about this topic, statistics and related others by exploring similar questions and additional content below.Similar questions
- Assume that the probability that an airplane engine will fail during a torture test is 12and that the aircraft in question has 4 engines. Construct a sample space for the torture test. Use S for survive and F for fail.arrow_forwardA hypothesis test produces a t statistic of t=2.01.If the researcher is using a two tailed test with x=0.05,how large does the sample have to be in order to reject the null hypothesis?arrow_forwardA veterinary nutritionist developed a diet for overweight dogs. The total volume of food consumed remains the same, but one-half of the dog food is replaced with a low-calorie “filler” such as canned green beans. Six overweight dogs were randomly selected from her practice and were put on this program. Their initial weights were recorded, and they were weighed again after 4 weeks. The results of the experiment are shown below. At α=0.05, can it be concluded that the dogs significantly lost weight?arrow_forward
- Victims of Violence A random survey of 70 women who were victims of violence found that 28 were attacked by relatives. A random survey of 48 men found that 7 were attacked by relatives. At α=0.05, can it be shown that the percentage of women who were attacked by relatives is different from the percentage of men who were attacked by relatives? Use p1 for the proportion of women who were attacked by relatives. Use the P-value method with tables. H0: ▼(Choose one) H1: ▼(Choose one) This hypothesis test is a ▼(Choose one) test. Compute the test value. Round the answer to at least 3 decimal places, if necessary. z= Find the P -value. Round the answer to four decimal places. P-value= Make the decision. What's the null hypothesis? Summarize the results. There is ▼(Choose one) that the proportion of women who were attacked by relatives is greater than the proportion of men who were attacked by relatives.arrow_forwardWater Consumption The Old Farmer's Almanac stated that the average consumption of water per person per day was 123 gallons. To test the hypothesis that this figure may no longer be true, a researcher randomly selected 17people and found that they used on average 118.4 gallons per day and s = 5.3. At α = 0.05, is there enough evidence to say that the Old Farmer's Almanac figure might no longer be correct? Use the P-value method. Assume the population is normally distributed. Use a TI-83 Plus/TI-84 Plus calculator. (a) State the hypotheses and identify the claim. (b) Find the P-value. Round the answer to at least four decimal places. (c) Make the decision. (d) Summarize the results.arrow_forwardPollution and altitude: In a random sample of 346 cars driven at low altitudes, 51 of them exceeded a standard of 11 grams of particulate pollution per gallon of fuel consumed. In an independent random sample of 80 cars driven at high altitudes, 20 of them exceeded the standard. Can you conclude that the proportion of high-altitude vehicles exceeding the standard differs from the proportion of low-altitude vehicles exceeding the standard? Let p1 denote the proportion of low altitude vehicles exceeding the standard and p2 denote the proportion of high altitude vehicles exceeding the standard. Use the a=0.05 level of significance and p-value method with the TI-84 plus calculator.arrow_forward
- A hypothesis test is conducted with H0 : µ = -25 vs. Ha: µ > -25. The hypothesis test sample finds x̅ = -23.6, s = 3, and n = 16 . Within which interval does the tail area P lie? A hypothesis test is conducted with H0 : µ = -25 vs. Ha: µ > -25. The hypothesis test sample finds x̅ = -23.6, s = 3, and n = 16 . Within which interval does the tail area P lie? D. 0.005 < P < 0.010 B. 0.025 < P < 0.050 A. 0.050 < P < 0.100 C. 0.010 < P < 0.025arrow_forwardVictims of Violence A random survey of 75 women who were victims of violence found that 22 were attacked by relatives. A random survey of 53 men found that 14 were attacked by relatives. At a=0.05, can it be shown that the percentage of women who were attacked by relatives is less than the percentage of men who were attacked by relatives? Use p1 for the proportion of women who were attacked by relatives. Use the P-value method with tables. Part 2. State the hypotheses and identify the claim with the correct hypothesis. Part 3. Compute the test value. Always round score values to two decimal places. Part 4. Find the -value. Round the answer to four decimal places. Part 5. Reject or not to reject the null hypothesis.arrow_forwardWater Consumption The Old Farmer's Almanac stated that the average consumption of water per person per day was 123 gallons. To test the hypothesis that this figure may no longer be true, a researcher randomly selected 25 people and found that they used on average 120.7 gallons per day and s= 5.3. At a = 0.01, is there enough evidence to say that the Old Farmer's Almanac figure might no longer be correct? Use the P-value method. Assume the population is normally distributed. Use a TI-83 Plus/TI-84 Plus calculator. find the p valuearrow_forward
- A hypothesis test is conducted with H0 : µ = 18 vs. Ha: µ > 18. Given that the population is normal and the sample finds x̅ = 21.2, σ = 10, and n = 9 , the tail area of this test is P =arrow_forwardDenise runs a dependent samples t-test and calculates r2subjects=.46 and r2condition=.23. a) SScondition is what proportion of SSsubjects (give in 2 decimals)?arrow_forwardAutomobiles Purchased An automobile owner found that 20 years ago, 76% of Americans said that they would prefer to purchase an American automobile. He believes that the number is much greater than 76% today. He selected a random sample of 58 Americans and found that 50 said that they would prefer an American automobile. Can it be concluded that the percentage today is greater than 76% ? At α=0.10 , is he correct? Use the P -value method with tables. (a) State the hypotheses and identify the claim. :H0 ▼(Choose one) :H1 ▼(Choose one) This hypothesis test is a ▼(Choose one) test. (b) Find the critical value(s). Round the answer to two decimal places. If there is more than one critical value, separate them with commas. Critical value(s): (c) Compute the test value. Always round z score values to at least two decimal places. =z (d) Make the decision.…arrow_forward
arrow_back_ios
SEE MORE QUESTIONS
arrow_forward_ios
Recommended textbooks for you
 College Algebra (MindTap Course List)AlgebraISBN:9781305652231Author:R. David Gustafson, Jeff HughesPublisher:Cengage Learning
 Algebra & Trigonometry with Analytic GeometryAlgebraISBN:9781133382119Author:SwokowskiPublisher:Cengage
College Algebra (MindTap Course List)
Algebra
ISBN:9781305652231
Author:R. David Gustafson, Jeff Hughes
Publisher:Cengage Learning
Algebra & Trigonometry with Analytic Geometry
Algebra
ISBN:9781133382119
Author:Swokowski
Publisher:Cengage
Hypothesis Testing - Solving Problems With Proportions; Author: The Organic Chemistry Tutor;https://www.youtube.com/watch?v=76VruarGn2Q;License: Standard YouTube License, CC-BY
Hypothesis Testing and Confidence Intervals (FRM Part 1 – Book 2 – Chapter 5); Author: Analystprep;https://www.youtube.com/watch?v=vth3yZIUlGQ;License: Standard YouTube License, CC-BY