bartleby

Concept explainers

bartleby

Videos

Question
100%
Book Icon
Chapter 9.1, Problem 23P

(a)

To determine

Construct a scatter diagram for the data.

Verify the values of x, x2, y, y2, and xy.

Find the value of r.

(a)

Expert Solution
Check Mark

Answer to Problem 23P

The scatter diagram for data is,

Bundle: Understandable Statistics: Concepts And Methods, 12th + Jmp Printed Access Card For Peck's Statistics + Webassign Printed Access Card For ... And Methods, 12th Edition, Single-term, Chapter 9.1, Problem 23P , additional homework tip  1

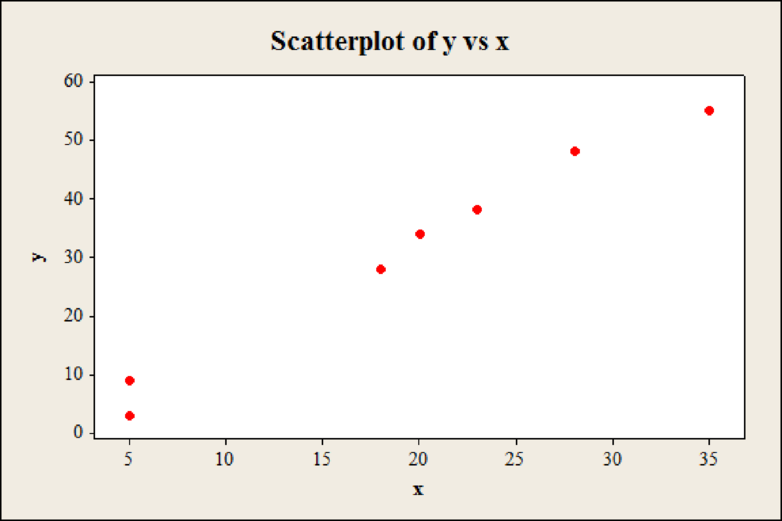
The value of r is 0.991.

Explanation of Solution

Calculation:

The formula for correlation coefficient is,

r=nxy(x)(y)nx2(x)2ny2(y)2

In the formula, n is the sample size.

The variable x denotes average annual hours per person spent in traffic delays and y denotes the average annual gallons of fuel wasted per person in traffic delays.

Step by step procedure to obtain scatter plot using MINITAB software is given below:

  • Choose Graph > Scatterplot.
  • Choose Simple. Click OK.
  • In Y variables, enter the column of x.
  • In X variables, enter the column of y.
  • Click OK.

The values are verified in the table below,

xyx2y2xy
284878423041344
5325915
20344001156680
3555122530251925
20344001156680
23385291444874
1828324784504
59258145
x=154y=249x2=3,712y2=9,959xy=6,067

Hence, the values are verified.

The number of data pairs are n=8. The value of correlation r is,

r=8(6067)(154×249)8(3712)(154)28(9959)(249)2=4853638346598017671=1019010,279.7169=0.991

Hence, the value of r is 0.991.

(b)

To determine

Find the value of x¯ and y¯ for variables based on averages.

Find the value of x¯ and y¯ for variables based on single individuals.

Find the value of sx and sy for variables based on averages.

Find the value of sx and sy for variables based on single individuals.

Identify the set in which standard deviations for x and y is larger.

Explain why standard deviations increase the value of r.

(b)

Expert Solution
Check Mark

Answer to Problem 23P

The value of x¯ for variables based on averages is 19.25.

The value of y¯ for variables based on averages is 31.13.

The value of x¯ for variables based on single individuals is 20.13.

The value of y¯ for variables based on single individuals is 31.88.

The value of sx for variables based on averages is 10.33.

The value of sy for variables based on averages is 17.76.

The value of sx for variables based on single individuals is 13.85.

The value of sy for variables based on single individuals is 25.18.

The standard deviation for variables based on single individuals is larger.

The values of sx and sy are in the denominator making the value of r larger for smaller standard deviations.

Explanation of Solution

Calculation:

Mean and standard deviation for variables based on averages:

Step by step procedure to obtain mean and standard deviation using MINITAB software is given as,

  • Choose Stat > Basic Statistics > Display Descriptive Statistics.
  • In Variables enter the column x, y.
  • Choose option statistics, and select Mean, standard deviation.
  • Click OK.

Output using MINITAB software is given below:

Bundle: Understandable Statistics: Concepts And Methods, 12th + Jmp Printed Access Card For Peck's Statistics + Webassign Printed Access Card For ... And Methods, 12th Edition, Single-term, Chapter 9.1, Problem 23P , additional homework tip  2

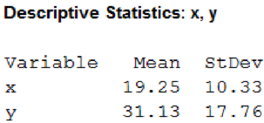
From MINITAB output, the mean of x is 19.25, the mean of y is 31.13, and standard deviation of x is 10.33, the standard deviation of y is 17.76.

Hence, the value of x¯ for variables based on averages is 19.25, the value of y¯ for variables based on averages is 31.13, the value of sx for variables based on averages is 10.33, and the value of sy for variables based on averages is 17.76.

Mean and standard deviation for variables based on single individuals:

Step by step procedure to obtain mean and standard deviation using MINITAB software is given as,

  • Choose Stat > Basic Statistics > Display Descriptive Statistics.
  • In Variables enter the column x, y.
  • Choose option statistics, and select Mean, standard deviation.
  • Click OK.

Output using MINITAB software is given below:

Bundle: Understandable Statistics: Concepts And Methods, 12th + Jmp Printed Access Card For Peck's Statistics + Webassign Printed Access Card For ... And Methods, 12th Edition, Single-term, Chapter 9.1, Problem 23P , additional homework tip  3

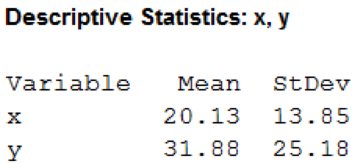
From MINITAB output, the mean of x is 20.13, the mean of y is 31.88, and standard deviation of x is 13.85, the standard deviation of y is 25.18.

Hence, the value of x¯ for variables based on single individuals is 20.13, the value of y¯ for variables based on single individuals is 31.88, the value of sx for variables based on single individuals is 13.85, and the value of sy for variables based on single individuals is 25.18.

It can be observed that value of sx(=13.85) for variables based on single individuals is larger than sx(=10.33 ) for variables based on averages. Similarly, the value of sy(=25.18) for variables based on single individuals is larger than sy(=17.76 ) for variables based on averages. Hence, the standard deviation for variables based on single individuals is larger.

The formula for correlation coefficient r in equation (1) is,

r=1n1[(xx¯)sx×(yy¯)sy]

In the formula the values of sx and sy are in the denominator. If the values of standard deviation are small, then it would increase the value of r. If the values of standard deviation are large, then it would decrease the value of r.

(c)

To determine

Construct a scatter diagram for the second set of data.

Verify the values of x, x2, y, y2, and xy.

Find the value of r.

(c)

Expert Solution
Check Mark

Answer to Problem 23P

The scatter diagram for second set of data is,

Bundle: Understandable Statistics: Concepts And Methods, 12th + Jmp Printed Access Card For Peck's Statistics + Webassign Printed Access Card For ... And Methods, 12th Edition, Single-term, Chapter 9.1, Problem 23P , additional homework tip  4

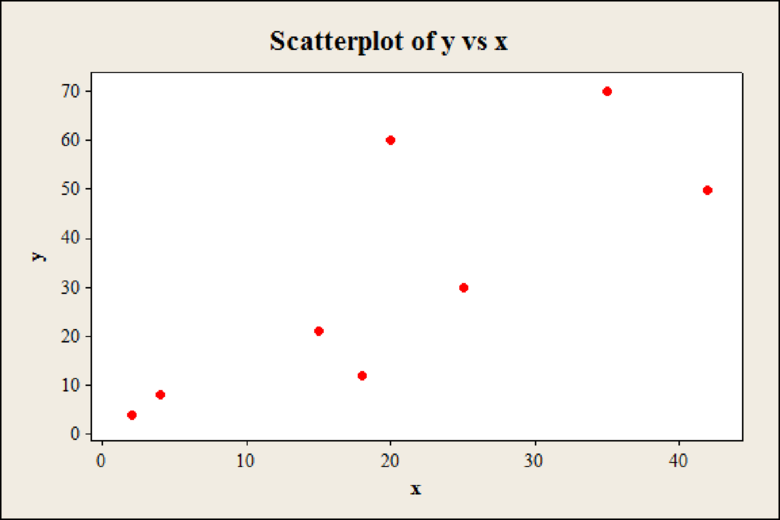
The value of r is 0.794.

Explanation of Solution

Calculation:

The variable x denotes average annual number of hours lost for the person and y denotes the average annual gallons of fuel wasted for the person.

Step by step procedure to obtain scatter plot using MINITAB software is given below:

  • Choose Graph > Scatterplot.
  • Choose Simple. Click OK.
  • In Y variables, enter the column of x.
  • In X variables, enter the column of y.
  • Click OK.

The values are verified in the table below,

xyx2y2xy
206040036001200
48166432
1812324144216
4250176425002100
1521225441315
2530625900750
244168
3570122549002450
x=161y=255x2=4,583y2=12,565xy=7,071

Hence, the values are verified.

The number of data pairs are n=8. The value of correlation r is,

r=8(7071)(161×255)8(4583)(161)28(12565)(255)2=56568410551074335495=1551319527.4879=0.794

Hence, the value of r is 0.794.

(d)

To determine

Identify the data for averages have a higher correlation coefficient than individual measurements or not.

Mention the reasons why hours lost per individual and fuel wasted per individual might vary more than the same quantities averaged over all the people in a city.

(d)

Expert Solution
Check Mark

Explanation of Solution

From part (a), the value of r for averages is 0.991. From part (c), the value of r for single observations is 0.794.

It can be observed that, the correlation coefficient for data of averages is larger than correlation coefficient for data of single observations.

The values of standard deviations for variables x and y based on data of averages are smaller when compared to the values of standard deviations for variables x and y based on data of single observations. The smaller standard deviation results in larger value of r, giving a higher correlation coefficient for data of averages.

Also, based on the central limit theorem the distribution of x distribution has the larger standard deviation when compared to x¯ distribution.

Want to see more full solutions like this?

Subscribe now to access step-by-step solutions to millions of textbook problems written by subject matter experts!

Chapter 9 Solutions

Bundle: Understandable Statistics: Concepts And Methods, 12th + Jmp Printed Access Card For Peck's Statistics + Webassign Printed Access Card For ... And Methods, 12th Edition, Single-term

Ch. 9.1 - Prob. 11PCh. 9.1 - Prob. 12PCh. 9.1 - Prob. 13PCh. 9.1 - Health Insurance: Administrative Cost The...Ch. 9.1 - Prob. 15PCh. 9.1 - Geology: Earthquakes Is the magnitude of an...Ch. 9.1 - Prob. 17PCh. 9.1 - Prob. 18PCh. 9.1 - Prob. 19PCh. 9.1 - Prob. 20PCh. 9.1 - Prob. 21PCh. 9.1 - Prob. 22PCh. 9.1 - Prob. 23PCh. 9.1 - Prob. 24PCh. 9.2 - Statistical Literacy In the least-squares line...Ch. 9.2 - Prob. 2PCh. 9.2 - Critical Thinking When we use a least-squares line...Ch. 9.2 - Prob. 4PCh. 9.2 - Prob. 5PCh. 9.2 - Critical Thinking: Interpreting Computer Printouts...Ch. 9.2 - Prob. 7PCh. 9.2 - For Problems 718, please do the following. (a)...Ch. 9.2 - Prob. 9PCh. 9.2 - For Problems 718, please do the following. (a)...Ch. 9.2 - Prob. 11PCh. 9.2 - Prob. 12PCh. 9.2 - For Problems 718, please do the following. (a)...Ch. 9.2 - Prob. 14PCh. 9.2 - Prob. 15PCh. 9.2 - For Problems 718, please do the following. (a)...Ch. 9.2 - Prob. 17PCh. 9.2 - Prob. 18PCh. 9.2 - Prob. 19PCh. 9.2 - Residual Plot: Miles per Gallon Consider the data...Ch. 9.2 - Prob. 21PCh. 9.2 - Prob. 22PCh. 9.2 - Prob. 23PCh. 9.2 - Prob. 24PCh. 9.2 - Prob. 25PCh. 9.3 - Prob. 1PCh. 9.3 - Prob. 2PCh. 9.3 - Prob. 3PCh. 9.3 - Prob. 4PCh. 9.3 - Prob. 5PCh. 9.3 - Prob. 6PCh. 9.3 - Prob. 7PCh. 9.3 - In Problems 712, parts (a) and (b) relate to...Ch. 9.3 - Prob. 9PCh. 9.3 - Prob. 10PCh. 9.3 - In Problems 712, parts (a) and (b) relate to...Ch. 9.3 - Prob. 12PCh. 9.3 - Prob. 13PCh. 9.3 - Prob. 14PCh. 9.3 - Prob. 15PCh. 9.3 - Expand Your Knowledge: Time Series and Serial...Ch. 9.3 - Prob. 17PCh. 9.4 - Statistical Literacy Given the linear regression...Ch. 9.4 - Prob. 2PCh. 9.4 - For Problems 3-6, use appropriate multiple...Ch. 9.4 - For Problems 3-6, use appropriate multiple...Ch. 9.4 - Prob. 5PCh. 9.4 - Prob. 6PCh. 9 - Prob. 1CRPCh. 9 - Prob. 2CRPCh. 9 - Prob. 3CRPCh. 9 - Prob. 4CRPCh. 9 - Prob. 5CRPCh. 9 - Prob. 6CRPCh. 9 - Prob. 7CRPCh. 9 - Prob. 8CRPCh. 9 - Prob. 9CRPCh. 9 - Prob. 10CRPCh. 9 - Prob. 1DHCh. 9 - Prob. 1LCCh. 9 - Prob. 1UTCh. 9 - Prob. 2UTCh. 9 - Prob. 3UTCh. 9 - Prob. 4UTCh. 9 - Prob. 5UTCh. 9 - Prob. 6UTCh. 9 - Prob. 7UTCh. 9 - In Problems 16, please use the following steps (i)...Ch. 9 - Prob. 2CURPCh. 9 - Prob. 3CURPCh. 9 - Prob. 4CURPCh. 9 - Prob. 5CURPCh. 9 - Prob. 6CURPCh. 9 - Prob. 8CURPCh. 9 - Linear Regression: Blood Glucose Let x be a random...
Knowledge Booster
Background pattern image
Statistics
Learn more about
Need a deep-dive on the concept behind this application? Look no further. Learn more about this topic, statistics and related others by exploring similar questions and additional content below.
Recommended textbooks for you
Text book image
Glencoe Algebra 1, Student Edition, 9780079039897...
Algebra
ISBN:9780079039897
Author:Carter
Publisher:McGraw Hill
Text book image
Big Ideas Math A Bridge To Success Algebra 1: Stu...
Algebra
ISBN:9781680331141
Author:HOUGHTON MIFFLIN HARCOURT
Publisher:Houghton Mifflin Harcourt
Correlation Vs Regression: Difference Between them with definition & Comparison Chart; Author: Key Differences;https://www.youtube.com/watch?v=Ou2QGSJVd0U;License: Standard YouTube License, CC-BY
Correlation and Regression: Concepts with Illustrative examples; Author: LEARN & APPLY : Lean and Six Sigma;https://www.youtube.com/watch?v=xTpHD5WLuoA;License: Standard YouTube License, CC-BY