
Videos
The function
describe the number of people,
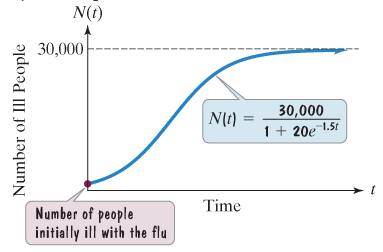
How many people became ill with the flu when the epidemic began? (When the epidemic began,
How many people were ill by the end of the third week
Why can’t the spread of an epidemic simply grow indefinitely? What does the horizontal asymptote shown in the graph indicate about the limiting size of the population that becomes ill?
Want to see the full answer?
Check out a sample textbook solution
Chapter 9 Solutions
Intermediate Algebra For College Students, Books A La Carte Edition (7th Edition)


- The formula for the amount A in an investmentaccount with a nominal interest rate r at any timet is given by A(t)=a(e)rt, where a is the amount ofprincipal initially deposited into an account thatcompounds continuously. Prove that the percentageof interest earned to principal at any time t can becalculated with the formula I(t)=ert1.arrow_forwardFor the following exercises, use the graphs to determine the intervals on which the functions are increasing, decreasing, or constant. 30. Find the local minimum of the function graphed in Exercise 27.arrow_forwardDoes a Limiting Value Occur? A rocket ship is flying away from Earth at a constant velocity, and it continues on its course indefinitely. Let D(t) denote its distance from Earth after t years of travel. Do you expect that D has a limiting value?arrow_forward
- (a) To obtain the graph of g(x)=2x1 , we start with the graph of f(x)=2x and shift it _____________ (upward/ downward) 1 unit. (b) To obtain the graph of h(x)=2x1 , we start with the graph of f(x)=2xand shift it to the (left/right) 1unit.arrow_forwardFor the following exercises, consider the graph shown in Figure 16. Estimate the point(s) at which the graph of f has a local maximum or a local minimum.arrow_forwardWhen a certain drug is taken orally, the concentration of the drug in the patient's bloodstream After t minutes is given by C(t)=0.06t0.0002t2 where 0t240 and concentration is measured in mg/L .When is the maximum serum concentration reached, and what is that maximum concentration?arrow_forward
- Sketch the graph of fx=5e0.17x.arrow_forwardRepeat the previous exercise to find the formula forthe APY of an account that compounds daily. Usethe results from this and the previous exercise todevelop a function I(n)for the APY of any accountthat compounds n times per year.arrow_forwardFor the following exercises, use the graphs to determine the intervals on which the functions are increasing, decreasing, or constant. 31. Find the local extrema for the function graphed in Exercise 28.arrow_forward

 Functions and Change: A Modeling Approach to Coll...AlgebraISBN:9781337111348Author:Bruce Crauder, Benny Evans, Alan NoellPublisher:Cengage Learning
 College AlgebraAlgebraISBN:9781305115545Author:James Stewart, Lothar Redlin, Saleem WatsonPublisher:Cengage Learning
 Glencoe Algebra 1, Student Edition, 9780079039897...AlgebraISBN:9780079039897Author:CarterPublisher:McGraw Hill
 College Algebra (MindTap Course List)AlgebraISBN:9781305652231Author:R. David Gustafson, Jeff HughesPublisher:Cengage Learning
 Big Ideas Math A Bridge To Success Algebra 1: Stu...AlgebraISBN:9781680331141Author:HOUGHTON MIFFLIN HARCOURTPublisher:Houghton Mifflin Harcourt