
Concept explainers
Videos
Finding the Equation of a Regression Line In Exercises 17–26, find the equation of the regression line for the data. Then construct a
22. Length and Girth of Harbor Seals The lengths (in centimeters) and girths (in centimeters) of 12 harbor seals (Adapted from Mess Landing Marine Laboratories)
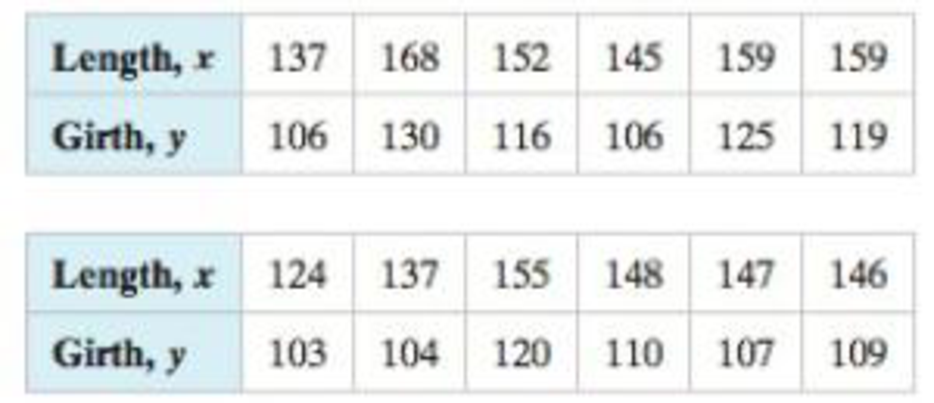
(a) x = 140 centimeters
(c) x = 164 centimeters
(b) x = 172 centimeters
(d) x = 158 centimeters
Want to see the full answer?
Check out a sample textbook solution
Chapter 9 Solutions
Elementary Statistics: Picturing the World (6th Edition)


- Life Expectancy The following table shows the average life expectancy, in years, of a child born in the given year42 Life expectancy 2005 77.6 2007 78.1 2009 78.5 2011 78.7 2013 78.8 a. Find the equation of the regression line, and explain the meaning of its slope. b. Plot the data points and the regression line. c. Explain in practical terms the meaning of the slope of the regression line. d. Based on the trend of the regression line, what do you predict as the life expectancy of a child born in 2019? e. Based on the trend of the regression line, what do you predict as the life expectancy of a child born in 1580?2300arrow_forwardNoise and Intelligibility Audiologists study the intelligibility of spoken sentences under different noise levels. Intelligibility, the MRT score, is measured as the percent of a spoken sentence that the listener can decipher at a cesl4ain noise level in decibels (dB). The table shows the results of one such test. (a) Make a scatter plot of the data. (b) Find and graph the regression line. (c) Find the correlation coefficient. Is a linear model appropriate? (d) Use the linear model in put (b) to estimate the intelligibility of a sentence at a 94-dB noise level.arrow_forwardXYZ Corporation Stock Prices The following table shows the average stock price, in dollars, of XYZ Corporation in the given month. Month Stock price January 2011 43.71 February 2011 44.22 March 2011 44.44 April 2011 45.17 May 2011 45.97 a. Find the equation of the regression line. Round the regression coefficients to three decimal places. b. Plot the data points and the regression line. c. Explain in practical terms the meaning of the slope of the regression line. d. Based on the trend of the regression line, what do you predict the stock price to be in January 2012? January 2013?arrow_forward
 Big Ideas Math A Bridge To Success Algebra 1: Stu...AlgebraISBN:9781680331141Author:HOUGHTON MIFFLIN HARCOURTPublisher:Houghton Mifflin Harcourt
 Functions and Change: A Modeling Approach to Coll...AlgebraISBN:9781337111348Author:Bruce Crauder, Benny Evans, Alan NoellPublisher:Cengage Learning
 Glencoe Algebra 1, Student Edition, 9780079039897...AlgebraISBN:9780079039897Author:CarterPublisher:McGraw Hill
 College AlgebraAlgebraISBN:9781305115545Author:James Stewart, Lothar Redlin, Saleem WatsonPublisher:Cengage Learning
 Algebra and Trigonometry (MindTap Course List)AlgebraISBN:9781305071742Author:James Stewart, Lothar Redlin, Saleem WatsonPublisher:Cengage Learning