
Concept explainers
Videos
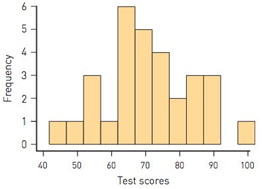
How different are they? (S) The following histogram shows the exam scores for 30 students in a freshman accounting class. Estimate the mean of these scores. Is the standard deviation of these scores likely to be closer to 12 or to 25?
Want to see the full answer?
Check out a sample textbook solution
Chapter 9 Solutions
The Heart of Mathematics: An Invitation to Effective Thinking, WileyPLUS NextGen Card with Loose-leaf Set Single Semester: An Invitation to Effective Thinking (Key Curriculum Press)
Additional Math Textbook Solutions
Mathematical Methods in the Physical Sciences
Calculus for Business, Economics, Life Sciences, and Social Sciences (13th Edition)
Mathematics with Applications In the Management, Natural and Social Sciences (11th Edition)
A Survey of Mathematics with Applications (10th Edition) - Standalone book
Thinking Mathematically (7th Edition)
Mathematics with Applications In the Management, Natural, and Social Sciences (12th Edition)


 Glencoe Algebra 1, Student Edition, 9780079039897...AlgebraISBN:9780079039897Author:CarterPublisher:McGraw Hill
 Big Ideas Math A Bridge To Success Algebra 1: Stu...AlgebraISBN:9781680331141Author:HOUGHTON MIFFLIN HARCOURTPublisher:Houghton Mifflin Harcourt