
Concept explainers
Videos
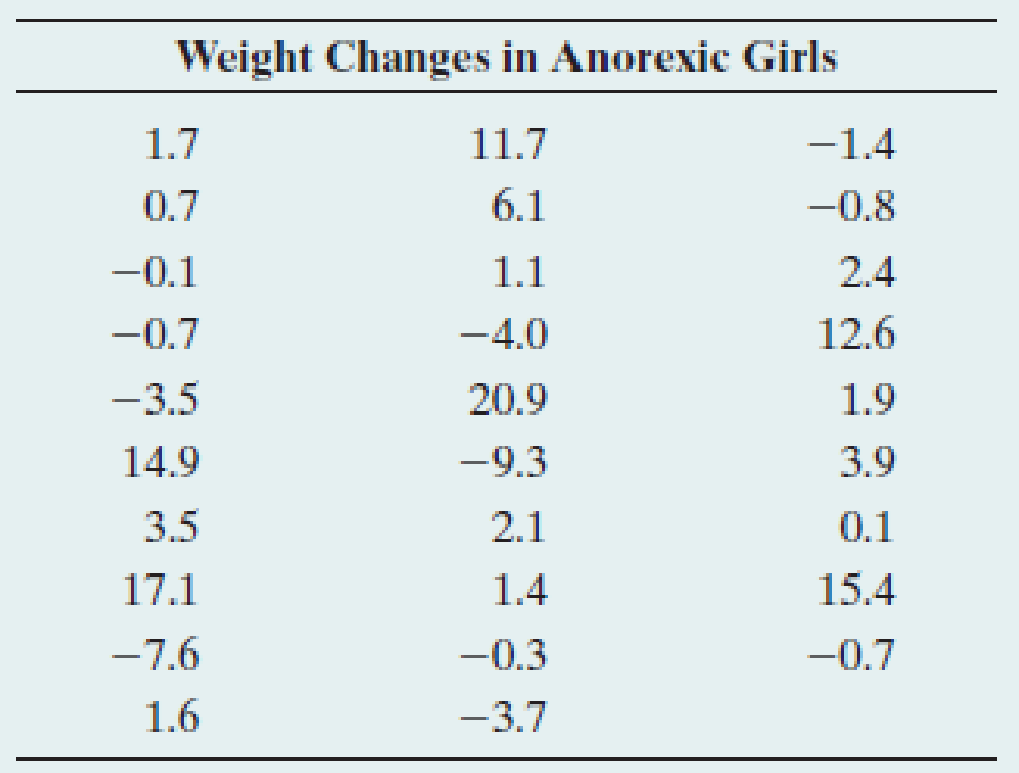
Sensitivity study Ideally, results of a statistical analysis should not depend greatly on a single observation. To check this, it’s a good idea to conduct a sensitivity study. This entails redoing the analysis after deleting an outlier from the data set or changing its value to a more typical value and checking whether results change much. If results change little, this gives us more faith in the conclusions that the statistical analysis reports. For the weight changes in Table 9.4 from the anorexia study (shown again here and available on the book’s website), the greatest reported value of 20.9 pounds was a severe outlier. Suppose this observation was actually 2.9 pounds but was incorrectly recorded. Redo the two-sided test of that example and summarize how the results differ. Does the ultimate conclusion depend on that single observation?
Want to see the full answer?
Check out a sample textbook solution
Chapter 9 Solutions
EBK STATISTICS


 Glencoe Algebra 1, Student Edition, 9780079039897...AlgebraISBN:9780079039897Author:CarterPublisher:McGraw Hill
 Big Ideas Math A Bridge To Success Algebra 1: Stu...AlgebraISBN:9781680331141Author:HOUGHTON MIFFLIN HARCOURTPublisher:Houghton Mifflin Harcourt
 Holt Mcdougal Larson Pre-algebra: Student Edition...AlgebraISBN:9780547587776Author:HOLT MCDOUGALPublisher:HOLT MCDOUGAL