
Concept explainers
Videos
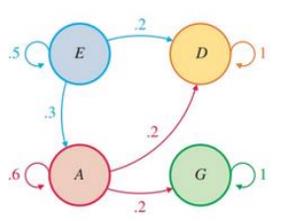
Repeat Example 5 for the following transition diagram:
Want to see the full answer?
Check out a sample textbook solution
Chapter 9 Solutions
Finite Mathematics for Business, Economics, Life Sciences and Social Sciences
Additional Math Textbook Solutions
Mathematics with Applications In the Management, Natural, and Social Sciences (12th Edition)
Mathematics with Applications In the Management, Natural and Social Sciences (11th Edition)
Calculus Volume 1
Using & Understanding Mathematics: A Quantitative Reasoning Approach (7th Edition)
Using and Understanding Mathematics: A Quantitative Reasoning Approach (6th Edition)
Thinking Mathematically (6th Edition)


- Parents are frequently concerned when their child seems slow to begin walking (although when the child finally walks, the resulting havoc sometimes has the parents wishing they could turn back the clock!). An article on this topic reported on an experiment in which the effects of several different treatments on the age at which a child first walks were compared. Children in the first group were given special walking exercises for 12 minutes per day beginning at age 1 week and lasting 7 weeks. The second group of children received daily exercises but not the walking exercises administered to the first group. The third and fourth groups were control groups. They received no special treatment and differed only in that the third group's progress was checked weekly, whereas the fourth group's progress was checked just once at the end of the study. Observations on age (in months) when the children first walked are shown in the accompanying table. Age n Total Treatment 1 9.00 9.50…arrow_forwardToward the middle of the harvesting season, peaches for canning come in three types, early, late, and extra late, depending on the expected date of ripening. During a certain week, the data to the right were recorded at a fruit delivery station. Complete parts (a) through (d) below. 40 trucks went out carrying early peaches; 71 carried late peaches; 52 carried extra late peaches; 26 carried early and late; 32 carried late and extra late; 11 carried early and extra late; 6 carried all three; 5 carried only figs (no peaches at all). a) How many trucks carried only late variety peaches? trucks (Type a whole number.) (b) How many carried only extra late? trucks (Type a whole number.) (c) How many carried only one type of peach? trucks (Type a whole number.) (d)How many trucks (in all) went out during the week? trucks (Type a whole number.)arrow_forwardThis is a multipart question 6.) Diesel Dave has modified his massive truck to combat global cooling, and to roll coal on his neighbor Environmentalist Ed. With each blast of diesel exhaust fumes, Diesel Dave releases sulfur dioxide in a giantblack cloud. Every morning as Diesel Dave is leaving home he rolls coal into Environmentalist Ed's yard. Not surprisingly, Environmentalist Ed is diligently collecting data on the air quality in his yard. Suppose Diesel Davereleases sulfur dioxide in a normally distributed manner with a mean of 2800 ppm and a standard deviation of 120 ppm. What is the probability that on a random morning he will release sulfur dioxide greater than 3000ppm? Suppose in order to sue Diesel Dave, Environmentalist Ed needs the daily average level of sulfur dioxide emissions to exceed 3000 ppm. However, he can choose to take his mean measurement over 2, 3, or 15 days. Which number of days would maximize Environmentalist Edís chances of suing Diesel Dave? (Hint: What…arrow_forward
- Toward the middle of the harvesting season, peaches for canning come in three types, early, late, and extra late, depending on the expected date of ripening. During a certain week, the data to the right were recorded at a fruit delivery station. Complete parts (a) through (d) below. 40 trucks went out carrying early peaches; 76 carried late peaches; 64 carried extra late peaches; 31 carried early and late; 34 carried late and extra late; 13 carried early and extra late; 6 carried all three; 8 carried only figs (no peaches at all). a. How many trucks carried only late variety peaches? b. How many carried only extra late? c. How many carried only one type of peach? d. How many trucks (in all) went out during the week? Thank you so mucharrow_forwardThe source table depicts the results of a fictional study investigating whether the number of hours of sleep a person gets varies with his or her gender (male, female) and with the number of energy drinks that he or she consumes in a day. Equal numbers of men and women were randomly assigned to drink either 0, 1, or 2 energy drinks during the course of a day and then record the number of hours they slept that night. Table: Coffee and Shop Source SS df MS F Gender 0.250 1 0.250 0.283 Energy Drinks 81.556 2 40.778 46.180 Gender X Drinks 2.667 2 1.330 1.510 Within…arrow_forwardThe following data consists of a matrix of transition probabilities (P) of three competing companies, the initial market share state ℼ(1), and the equilibrium probability states. Assume that each state represents a firm (Company 1, Company 2, and Company 3, respectively) and the transition probabilities represent changes from one month to the next. The market share of Company 3 after three periods is a. 0.259 b. 0.261 c. 0.283 d. 0.296arrow_forward
- Subject: Stochastic process Question 1 is attached to the image section belowarrow_forwardch 15 end. 6: In the book Business Research Methods (5th ed.), Donald R. Cooper and C. William Emory discuss studying the relationship between on-the-job accidents and smoking. Cooper and Emory describe the study as follows: Suppose a manager implementing a smoke-free workplace policy is interested in whether smoking affects worker accidents. Since the company has complete reports of on-the-job accidents, she draws a sample of names of workers who were involved in accidents during the last year. A similar sample from among workers who had no reported accidents in the last year is drawn. She interviews members of both groups to determine if they are smokers or not.arrow_forwardQuestion 4 A country club wants to exam the effects of a new marketing campaign that attempts to get more people within the community to become members. In many communities, when people buy a house in the area, they receive a “Welcome Wagon” gift basket containing coupons to local restaurants. The idea of the marketing campaign is to include a free two month membership to the country club in the gift basket with the hope that once “new” residents try the country club then at least a certain proportion will want to become real members. One member of the Club’s Executive Council believes that at least 25% of the people who receive the coupons for the free membership will use the coupon. When testing the hypothesis that at least 25% of the people who receive the coupons for the free membership will use the coupon, what is the null and alternative hypothesis?arrow_forward
- Suppose a two state experiment has the following transition matrix: P= 0.8 0.2 0.6 0.4 Answer the following questions: 1. Find P(4). 2. If the experiment is in state 2 on the first observation, what is the probability it is in state 2 on the fifth observation? 3. If the experiment is in state 2 on the first observation, what is the probability it is in state 2 on the third and fifth observation?arrow_forward1. Expenses for Joey's college attendance next year are as follows (in $): Tuition = 8400 Dormitory = 5400 Meals ~Unif(900,1350) Entertainment ~Unif(600,1200) Transportation ~Unif(200,600) Books ~Unif(400,800) Here are the income streams the student has for next year: Scholarship = 3000 Parents = 4000 Waiting Tables ~Unif(3000,5000) Library Job ~Unif(2000,3000) Use Monte Carlo simulation to estimate the expected value of the loan that will be needed to enable Joey to go to college next year.arrow_forwardGeorge Kyparisis owns a company that manufactures sailboats. Actual demand for George's sailboats during each of the past four seasons was as follows: Season 1 2 3 4Winter 1,400 1,240 1,080 920Spring 1,520 1,420 1,640 1,540Summer 1,000 2,140 2,040 1,960Fall 600 750 650 520 George has forecasted that annual demand for his sailboats in year 5 will equal 6,500 sailboats. Based on the given data and using the multiplicative seasonal model, the demand level for George's sailboats in the spring of year 5 will be nothing sailboats (enter a whole number).arrow_forward
 Discrete Mathematics and Its Applications ( 8th I...MathISBN:9781259676512Author:Kenneth H RosenPublisher:McGraw-Hill Education
 Mathematics for Elementary Teachers with Activiti...MathISBN:9780134392790Author:Beckmann, SybillaPublisher:PEARSON
 Thinking Mathematically (7th Edition)MathISBN:9780134683713Author:Robert F. BlitzerPublisher:PEARSON
 Discrete Mathematics With ApplicationsMathISBN:9781337694193Author:EPP, Susanna S.Publisher:Cengage Learning,
 Pathways To Math Literacy (looseleaf)MathISBN:9781259985607Author:David Sobecki Professor, Brian A. MercerPublisher:McGraw-Hill Education