Videos
a.
Find the p-value and state the conclusion.
a.
Answer to Problem 26E
The p-value is 0.039.
The conclusion is “reject the null hypothesis”.
Explanation of Solution
Calculation:
The given information is the sample size is
The hypotheses are given below:
Null hypothesis:
Alternative hypothesis:
Test statistic:
The formula for finding test statistic is as follows:
Here,
Substitute
Thus, the value of the test statistic is 2.10.
The degrees of freedom is,
Software Procedure:
Step-by-step procedure to obtain the probability value using Excel:
- Open an EXCEL sheet and select the cell A1.
- Enter the formula =T.DIST.2T(2.10,64) in the cell A1.
- Press Enter.
Output using the EXCEL software is given below:
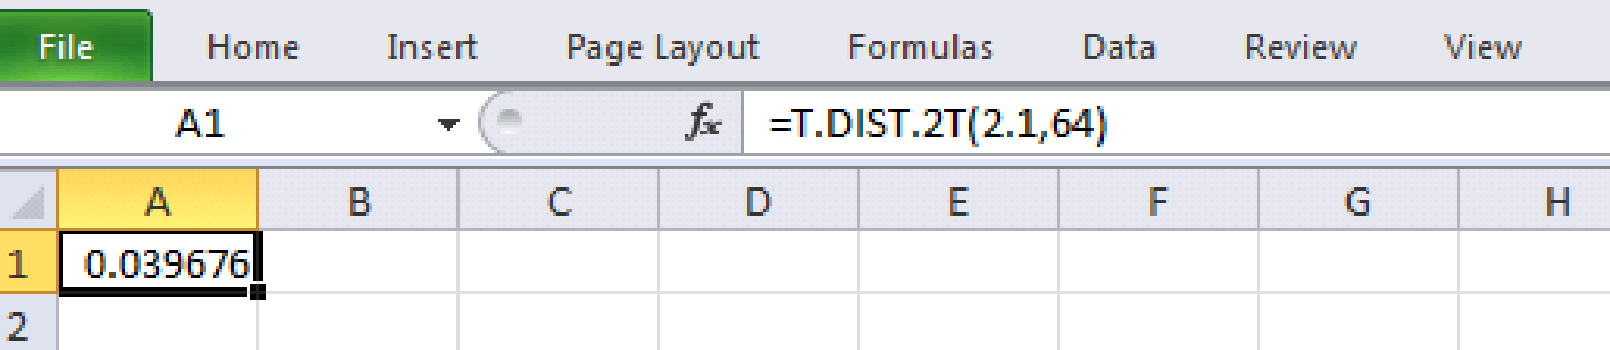
From the output, the exact p-value is approximately 0.040.
Rejection rule:
If
If
Conclusion:
Here, the p-value is less than the level of significance.
That is,
By the rejection rule, the null hypothesis is rejected.
b.
Calculate the p-value and draw the conclusion.
b.
Answer to Problem 26E
The p-value is 0.013.
The conclusion is “reject the null hypothesis”.
Explanation of Solution
Calculation:
The given information is that the sample size is
Test statistic:
Substitute
Thus, the value of the test statistic is –2.57.
From part (a), the degrees of freedom is 64.
Software Procedure:
Step-by-step procedure to obtain the probability value using Excel:
- Open an EXCEL sheet and select the cell A1.
- Enter the formula =T.DIST.2T(2.57,64) in the cell A1.
- Press Enter.
Output using the EXCEL software is given below:
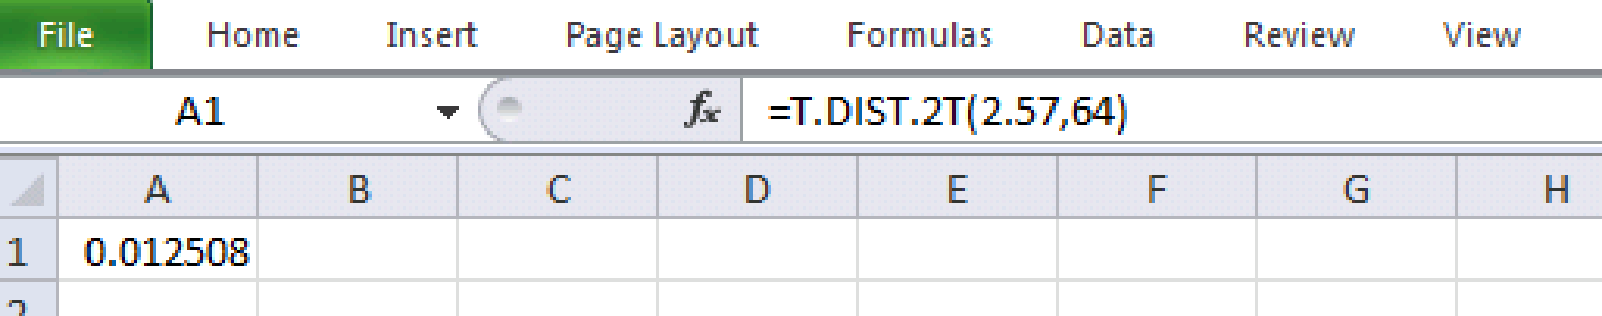
From the output, the exact p-value is approximately 0.0125.
Conclusion:
Here, the p-value is less than the level of significance.
That is,
By the rejection rule, the null hypothesis is rejected.
c.
Obtain the p-value and claim the conclusion.
c.
Answer to Problem 26E
The p-value is 0.130.
The conclusion is “do not reject the null hypothesis”.
Explanation of Solution
Calculation:
The given information is that the sample size is
Test statistic:
Substitute
Thus, the value of the test statistic is 1.54.
From part (a), the degrees of freedom is 64.
Software Procedure:
Step-by-step procedure to obtain the probability value using Excel:
- Open an EXCEL sheet and select the cell A1.
- Enter the formula =T.DIST.2T(1.54,64) in the cell A1.
- Press Enter.
Output using the EXCEL software is given below:
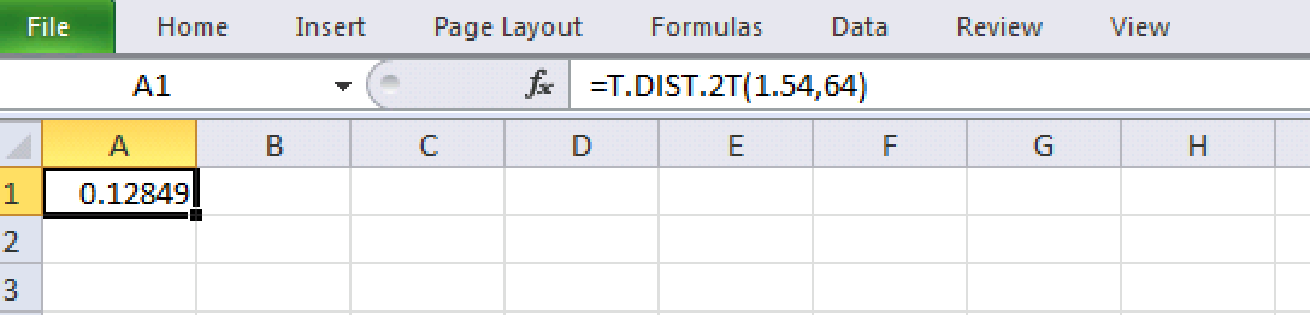
From the output, the exact p-value is approximately 0.01285.
Conclusion:
Here, the p-value is greater than the level of significance.
That is,
By the rejection rule, the null hypothesis is not rejected.
Want to see more full solutions like this?
Chapter 9 Solutions
MODERN BUSINESS STAT...-ACCESS >CUSTOM<


- In doing a hypothesis test of the population proportion at α=0.02 level of significance, we got the p-value to be 0.006. What would our conclusion to the test be? Why? A. Do NOT Reject H0 since the p-value > α B. Reject H1 since the p-value < α C. Reject H0 since the p-value < α D. Do NOT Reject H0 since the p-value < αarrow_forward1. Which of the following is the correct statement of the null hypothesis for a repeated-measures hypothesis test? a. md=0 (incorrect answer) b. μD=0μ c. μ1=μ2 d. M1=M2arrow_forwardThe proportion of mango trees on an island that produce only dwarf fruit is p1. The proportion of mango trees on a different island that produce only dwarf fruit is p2. What is the null hypothesis for a test to determine if the proportions are different between the two islands? Select the correct answer below: H0: p1−p2≠0 H0: p1−p2=0 H0: p1−p2>0 H0: p1−p2<0arrow_forward
- In each of Exercises, we have given the P-value for a hypothesis test. For each exercise, refer to Table to determine the strength of the evidence against the null hypothesis. P-value Evidence against H0 P > 0.10 Weak or none 0.05 < P ≤ 0.10 Moderate 0.01 < P ≤ 0.05 Strong P ≤ 0.01 Very strong P = 0.086arrow_forwardThe effectiveness of a new bug repellent is tested on 1616 subjects for a 10 hour period. (Assume normally distributed population.) Based on the number and location of the bug bites, the percentage of surface area exposed protected from bites was calculated for each of the subjects. The results were as follows: ?⎯⎯⎯=92x¯=92, ?=13 s=13 The new repellent is considered effective if it provides a percent repellency of at least 9090. Using ?=0.05α=0.05, construct a hypothesis test with null hypothesis ?≤90μ≤90 and alternative hypothesis ?>90μ>90 to determine whether the mean repellency of the new bug repellent is greater than 9090 by computing the following: (a) the degree of freedom (b) the test statistic The final conclusion is A. There is not sufficient evidence to reject the null hypothesis that ?≤90μ≤90. Our results do not provide enough evidence that the new bug repellent is effective. B. We can reject the null hypothesis that ?≤90μ≤90. Our results indicate that…arrow_forwardConsider the following hypothesis test. H0: μ1 − μ2 = 0 Ha: μ1 − μ2 ≠ 0 The following results are for two independent samples taken from the two populations. Sample 1 Sample 2 n1 = 70 n2 = 80 x1 = 106 x2 = 108 σ1 = 8.4 σ2 = 7.6 (a) What is the p-value? (Round your answer to four decimal places. show work not done on calculator) (b) With α = 0.01, using the p-value approach, what is your hypothesis testing conclusion? Why? Explainarrow_forward
- If the proportion of the population in City A that is over 65 years old is p1 and the proportion of the population in City B that is over 65 years old is p2, what is the null hypothesis for a test to determine if the proportion of the population that is over 65 years old is greater in City A? Select the correct answer below: H0: p1−p2=0 H0: p1−p2>0 H0: p1−p2<0 H0: p1−p2≠0arrow_forwardConsider the following hypothesis test:H0 : μ ≤12Ha : μ >12 A sample of 25 provided a sample mean 14 and standard deviation 4.32. Computeand state your conclusion using α = 0.05.arrow_forwardConsider the following hypothesis statement using α=0.10 and the following data from two independent samples. Complete parts a and b below. H0: p1−p2≥0 x1=74 x2=76 H1: p1−p2<0 n1=125 n2=170 a. Calculate the appropriate test statistic and interpret the result. What is the test statistic? What is/are the critical value(s)? b. Calculate the p-value and interpret the result. What is the p-value?arrow_forward
- For each of the following sets of hypotheses, sample sizes, and test statistic values, calculate the appropriate p-v (It may help to draw a picture for each case.) H0: π = 0.6 Ha: π ≠ 0.6, sample size n = 150, test statistic z = 0.83. H0: µ = 23 Ha: µ ≠ 23, sample size n = 20, test statistic t = 2.17.arrow_forwardConsider the following hypothesis test. H0: μ1 − μ2 = 0 Ha: μ1 − μ2 ≠ 0 The following results are for two independent samples taken from the two populations. Sample 1 Sample 2 n1 = 70 n2 = 80 x1 = 106 x2 = 108 σ1 = 8.4 σ2 = 7.6 (a) With α = 0.01, using the p-value approach, what is your hypothesis testing conclusion? Why? Explainarrow_forwardFind the P-value that corresponds to the given standard score, and determine whether to reject the null hypothesis at the 0.10 significance level. Is the alternative hypothesis supported? z=−1.2 for H0:μ=25 centimeters and Ha:μ<25 centimeters the p value is ?arrow_forward
 MATLAB: An Introduction with ApplicationsStatisticsISBN:9781119256830Author:Amos GilatPublisher:John Wiley & Sons Inc
 Probability and Statistics for Engineering and th...StatisticsISBN:9781305251809Author:Jay L. DevorePublisher:Cengage Learning
 Statistics for The Behavioral Sciences (MindTap C...StatisticsISBN:9781305504912Author:Frederick J Gravetter, Larry B. WallnauPublisher:Cengage Learning
 Elementary Statistics: Picturing the World (7th E...StatisticsISBN:9780134683416Author:Ron Larson, Betsy FarberPublisher:PEARSON
 The Basic Practice of StatisticsStatisticsISBN:9781319042578Author:David S. Moore, William I. Notz, Michael A. FlignerPublisher:W. H. Freeman
 Introduction to the Practice of StatisticsStatisticsISBN:9781319013387Author:David S. Moore, George P. McCabe, Bruce A. CraigPublisher:W. H. Freeman