
Concept explainers
Videos
a.
To identify: The claim and state
a.
Answer to Problem 13E
The claim is that “the variance in the number of calories differs between the two brands”.
Null hypothesis:
Alternative hypothesis:
Explanation of Solution
Given info:
The data shows the areas (in square miles).
Justification:
Here, the claim is that “the variance in area is greater for eastern cities than for western cities”. This can be written as
b.
To find: The critical value for 5% level and 1% level.
b.
Answer to Problem 13E
The critical value at 5% level is 4.950 and the critical value at 1% level is 10.67.
Explanation of Solution
Calculation:
The degrees of freedom for numerator is,
The degrees of freedom for denominator is,
Software Procedure:
Step-by-step procedure to obtain the critical value using the MINITAB software:
- Choose Graph > Probability Distribution Plot choose View Probability> OK.
- From Distribution, choose F.
- Enter Numerator df as 6 and Denominator df as 5.
- Click the Shaded Area tab.
- Choose Probability value and Right Tail for the region of the curve to shade.
- Enter the Probability value as 0.05.
- Click OK.
Output using the MINITAB software is given below:
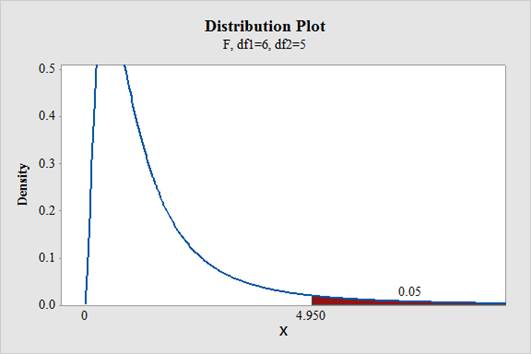
From the output, the critical value is 4.950.
Level of significance,
Software Procedure:
Step-by-step procedure to obtain the critical value using the MINITAB software:
- Choose Graph > Probability Distribution Plot choose View Probability> OK.
- From Distribution, choose F.
- Enter Numerator df as 6 and Denominator df as 5.
- Click the Shaded Area tab.
- Choose Probability value and Right Tail for the region of the curve to shade.
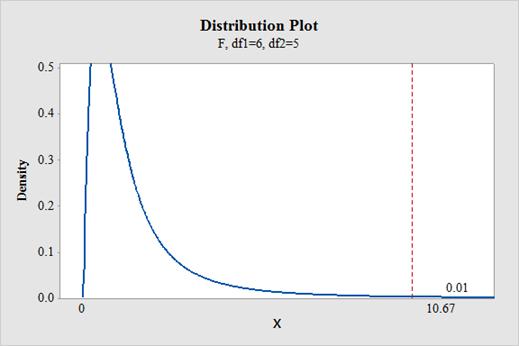
- Enter the Probability value as 0.01.
- Click OK.
Output using the MINITAB software is given below:
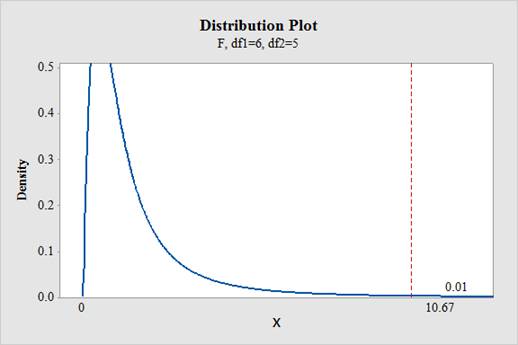
From the output, the critical value is 10.67.
c.
To find: The test value.
c.
Answer to Problem 13E
The test statistic value is 9.80.
Explanation of Solution
Calculation:
Software Procedure:
Step-by-step procedure to obtain the test value using the MINITAB software:
- Choose Stat > Basic Statistics >2 Variance.
- Choose Each sample is in its own column.
- In Sample 1, enter the column of Eastern.
- In Sample 2, enter the column of Western.
- Check Options; enter Confidence level as 95%.
- Choose greater than in alternative.
- Click OK.
Output using the MINITAB software is given below:
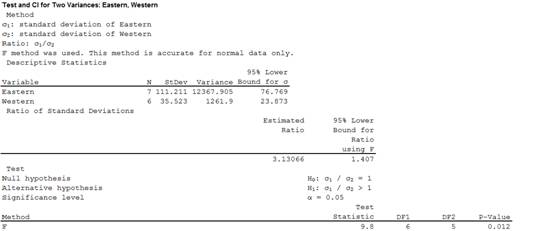
From the output, the test value is 9.80.
d.
To decide: Whether to reject or fail to reject the null hypothesis at a level of significance of
d.
Answer to Problem 13E
For 5% level, the decision is “reject the null hypothesis”.
For 1% level, the decision is “fail to reject the null hypothesis”.
Explanation of Solution
Calculation:
Software Procedure:
Step-by-step procedure to indicate the appropriate area and critical value using the MINITAB software:
- Choose Graph > Probability Distribution Plot choose View Probability> OK.
- From Distribution, choose F.
- Enter Numerator df as 8 and Denominator df as 8.
- Click the Shaded Area tab.
- Choose Probability value and Both Tail for the region of the curve to shade.
- Enter the Probability value as 0.05.
- Enter 9.80 under show reference lines at X values
- Click OK.
Output using the MINITAB software is given below:
From the output, it can be observed that the test statistic value falls in the rejection region. Therefore, the null hypothesis is rejected.
Software Procedure:
Step-by-step procedure to indicate the appropriate area and critical value using the MINITAB software:
- Choose Graph > Probability Distribution Plot choose View Probability> OK.
- From Distribution, choose F.
- Enter Numerator df as 8 and Denominator df as 8.
- Click the Shaded Area tab.
- Choose Probability value and Both Tail for the region of the curve to shade.
- Enter the Probability value as 0.01.
- Enter 9.80 under show reference lines at X values
- Click OK.
Output using the MINITAB software is given below:
From the output, it can be observed that the test statistic value do not falls in the rejection region. Therefore, the null hypothesis is not rejected.
e.
To summarize: The result.
e.
Answer to Problem 13E
The conclusion is that, there is enough evidence to support the claim that the variance in area is greater for eastern cities than for western cities at 5% level of significance.
The conclusion is that, there is no enough evidence to support the claim that the variance in area is greater for eastern cities than for western cities at 1% level of significance.
Explanation of Solution
Justification:
For 5% level:
From part (d), the null hypothesis is rejected. Thus, there is enough evidence to support the claim that the variance in area is greater for eastern cities than for western citiesat 5% level of significance.
For 1% level:
From part (d), the null hypothesis is not rejected. Thus, there is no enough evidence to support the claim that the variance in area is greater for eastern cities than for western cities at 1% level of significance.
Want to see more full solutions like this?
Chapter 9 Solutions
ELEMENTARY STATISTICS CONNECT CODE>CUS


- State the null and alternative hypotheses to be used in testing the following claims also explain type of test.(a) At most, 20% of next year’s wheat crop will be exported to the Soviet Union.(b) On the average, American homemakers drink 3 cups of coffee per day.(c) The proportion of college graduates in Virginia this year who majored in the social sciences is at least 0.15.(d) The average donation to the American Lung Association is no more than $10.(e) Residents in suburban Richmond commute, on the average, 15 kilometers to their place of employmentarrow_forwardFollow the steps in testing hypothesis to answer the problem:arrow_forwardIf the proportion of the population in City A that is over 65 years old is p1 and the proportion of the population in City B that is over 65 years old is p2, what is the null hypothesis for a test to determine if the proportion of the population that is over 65 years old is greater in City A? Select the correct answer below: H0: p1−p2=0 H0: p1−p2>0 H0: p1−p2<0 H0: p1−p2≠0arrow_forward
- Given that the P-value for the hypothesis test is 0.501, what do you conclude? Does it appear that the heights were obtained through measurement or that the subjects reported their heights?arrow_forwardYou are working for the South Tahoe Tourist Bureau and are interested in determining if there is a relationship between the casino people frequent and the type of gambling that they do at the casino Table Games Slots Sports Harrah’s 50 60 12 Hard Rock 18 22 6 MontBleu 33 29 20 Harvey’s 41 39 20 a. State the null and alternative hypotheses. b. State which hypothesis test should be used. Calculate the p-Value and state the command you entered in the calculator. c. State the conclusion in the context of the problem.arrow_forwardAfter running a hypothesis test comparing the number of jelly beans that a sample of children eat over the course of the year with the number of jelly beans children eat in the overall population over the course of the year, I conclude that the sample of children ate significantly more jelly beans than the overall population of children. If the sample of children actually ate the same number of jelly beans as the overall population, my conclusion is an example of _______. a. sampling error b. a Type II error c. a Type I error d. a valid conclusionarrow_forward
- In each of Exercises, we have given the P-value for a hypothesis test. For each exercise, refer to Table to determine the strength of the evidence against the null hypothesis. P-value Evidence against H0 P > 0.10 Weak or none 0.05 < P ≤ 0.10 Moderate 0.01 < P ≤ 0.05 Strong P ≤ 0.01 Very strong P = 0.086arrow_forwardMaria has two routes, E and W, she can take when commuting to work. Both routes go through a railroad crossing, and sometimes she needs to stop at the crossing to allow trains to pass. She claims that the proportion of times she needs to stop when taking route E is different from the proportion of times she needs to stop when taking route W. She conducted the following hypothesis test at the significance level of α=0.10. H0:pE=pWHa:pE≠pW In the hypotheses, pE represents the proportion of times she needs to stop at the crossing when using route E, and pWrepresents the proportion of times she needs to stop at the crossing when using route W. All conditions for inference were met, and the resulting p-value was 0.37. Which of the following is the correct decision for the test? The p-value is less than α, and the null hypothesis is rejected. There is convincing evidence to support the claim that the proportion of times she needs to stop at the crossing is different for the…arrow_forwardBrown wants to conduct an assessment of where employees live and how employees work. Brown wanted to know if where you lived was related to how you worked. What hypothesis tests can be used in this case?arrow_forward
- Use the 7 steps in Hypothesis Testing in answering the problems below.arrow_forwardThe results of a hypothesis test are reported as follows: t(21)=2.38, p<.05. What was the statistical decision and how big was the sample?arrow_forwardYou are given the following hypotheses: H0: p = 0.3HA: p ≠ 0.3 We know that the sample size is 90. For what sample proportion would the p-value be equal to 0.1? Assume that all conditions necessary for inference are satisfied.arrow_forward
 MATLAB: An Introduction with ApplicationsStatisticsISBN:9781119256830Author:Amos GilatPublisher:John Wiley & Sons Inc
 Probability and Statistics for Engineering and th...StatisticsISBN:9781305251809Author:Jay L. DevorePublisher:Cengage Learning
 Statistics for The Behavioral Sciences (MindTap C...StatisticsISBN:9781305504912Author:Frederick J Gravetter, Larry B. WallnauPublisher:Cengage Learning
 Elementary Statistics: Picturing the World (7th E...StatisticsISBN:9780134683416Author:Ron Larson, Betsy FarberPublisher:PEARSON
 The Basic Practice of StatisticsStatisticsISBN:9781319042578Author:David S. Moore, William I. Notz, Michael A. FlignerPublisher:W. H. Freeman
 Introduction to the Practice of StatisticsStatisticsISBN:9781319013387Author:David S. Moore, George P. McCabe, Bruce A. CraigPublisher:W. H. Freeman