
Videos
The article “An Investigation into the Ball Burnishing of Aluminium Alloy 6061-T6” (M. El-Axir. J Engineering Manufacture. 2007:1733–1742) presents the results of study that investigated the effects of three burnishing factors on the reduction in diameter of the workpiece (in μm). The factors are A: Burnishing speed, B: Burnishing force, and C: Burnishing feed. The results presented in the following table form a 23 factorial design (some additional results are omitted).
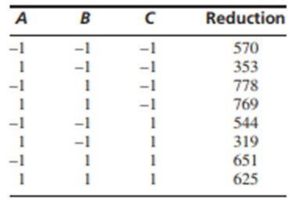
- a. Compute estimates of the main effects and the interactions.
- b. Is it possible to compute an error sum of squares? Explain.
- c. Arc any of the interactions among the larger effects? If so, which ones?
- d. Someone claims that the additive model holds. Do the results tend to support this statement? Explain.
Want to see the full answer?
Check out a sample textbook solution
Chapter 9 Solutions
STATISTICS FOR ENGR.+SCI.(LL)-W/ACCESS
Additional Math Textbook Solutions
Introductory Statistics
Statistics: The Art and Science of Learning from Data (4th Edition)
Introductory Statistics (10th Edition)
Elementary Statistics: Picturing the World (6th Edition)
Business Statistics: A First Course (7th Edition)
Introduction to Statistical Quality Control


- The article “Withdrawal Strength of Threaded Nails” (D. Rammer, S. Winistorfer, and D. Bender, Journal of Structural Engineering 2001:442–449) describes an experiment comparing the ultimate withdrawal strengths (in N/mm) for several types of nails. For an annularly threaded nail with shank diameter 3.76 mm driven into spruce-pine-fir lumber, the ultimate withdrawal strength was modeled as lognormal with μ = 3.82 and σ = 0.219. For a helically threaded nail under the same conditions, the strength was modeled as lognormal with μ = 3.47 and σ = 0.272. a) What is the mean withdrawal strength for annularly threaded nails? b) What is the mean withdrawal strength for helically threaded nails? c) For which type of nail is it more probable that the withdrawal strength will be greater than 50 N/mm? d) What is the probability that a helically threaded nail will have a greater withdrawal strength than the median for annularly threaded nails? e) An experiment is performed in which withdrawal…arrow_forwardIn the production of synthetic motor lubricant from coal, a new catalyst has been discovered that seems to affect the viscosity index of the lubricant. In an experiment consisting of 23 production runs, 11 used the new catalyst and 12 did not. After each production run, the viscosity index of the lubricant was determined to be as follows. With catalyst 4.0 4.4 2.6 1.2 3.9 4.2 2.8 3.2 4.1 2.1 1.6 Without catalyst 3.3 2.3 3.7 3.0 4.3 2.7 4.5 1.5 3.6 2.5 2.2 3.4 The two samples are independent. Use a 0.01 level of significance to test the null hypothesis that the viscosity index is unchanged by the catalyst against the alternate hypothesis that the viscosity index has changed. 1.) Find the sample test statistic. (Use 2 decimal places.)2.) For the sign test, rank-sum test, and Spearman correlation coefficient test, find the P-value of the sample test statistic. For the runs test of randomness, find the critical values from Table 10 of Appendix II. (Use 4 decimal places.)arrow_forwardThe Etruscans. Anthropologists are still trying to unravel the mystery of the origins of the Etruscan empire, a highly advanced Italic civilization formed around the eighth century B.C. in central Italy. Were they native to the Italian peninsula or, as many aspects of their civilization suggest, did they migrate from the East by land or sea? The maximum head breadth, in millimeters, of 70 modern Italian male skulls and that of 84 preserved Etruscan male skulls were analyzed to help researchers decide whether the Etruscans were native to Italy. The resulting data can be found on the WeissStats site. [SOURCE: N. Barnicot and D. Brothwell, “The Evaluation of Metrical Data in the Comparison of Ancient and Modern Bones.” In a. use the technology of your choice to obtain boxplots for the data sets, using the same scale. b. compare the data sets by using your results from part (a), paying special attention to center and variation.arrow_forward
- The Etruscans. Anthropologists are still trying to unravel the mystery of the origins of the Etruscan empire, a highly advanced Italic civilization formed around the eighth century B.C. in central Italy. Were they native to the Italian peninsula or, as many aspects of their civilization suggest, did they migrate from the East by land or sea? The maximum head breadth, in millimeters, of 70 modern Italian male skulls and that of 84 preserved Etruscan male skulls were analyzed to help researchers decide whether the Etruscans were native to Italy. The resulting data can be found on the WeissStats site. [SOURCE: N. Barnicot and D. Brothwell, “The Evaluation of Metrical Data in the Comparison of Ancient and Modern Bones.” In Medical Biology and Etruscan Origins, G. Wolstenholme and C. O’Connor, eds., Little, Brown&Co., 1959] a. use the technology of your choice to obtain boxplots for the data sets, using the same scale. b. compare the data sets by using your results from part (a), paying…arrow_forwardThe Etruscans. Anthropologists are still trying to unravel the mystery of the origins of the Etruscan empire, a highly advanced Italic civilization formed around the eighth century B.C. in central Italy. Were they native to the Italian peninsula or, as many aspects of their civilization suggest, did they migrate from the East by land or sea? The maximum head breadth, in millimeters, of 70 modern Italian male skulls and that of 84 preserved Etruscan male skulls were analyzed to help researchers decide whether the Etruscans were native to Italy. The resulting data can be found on theWeissStats site. [SOURCE: N. Barnicot and D. Brothwell, “The Evaluation of Metrical Data in the Comparison of Ancient and Modern Bones.” In Medical Biology and Etruscan Origins, G. Wolstenholme and C. O’Connor, eds., Little, Brown&Co., 1959] a. use the technology of your choice to determine the mean and median of each of the two data sets. b. compare the two data sets by using your results from part (a).arrow_forwardSolve An article in the ASCE Journal of Energy Engineering (1999, Vol. 125, pp.59-75) describes a study of the thermal inertia properties of autoclaved aerated concrete used as a building material. Five samples of the material were tested in a structure, and the average interior temperatures (°C) reported were as follows: 23.01, 22.22, 22.04, 22.62, and 22.59. Test that the average interior temperature is equal to 22.5°C using alpha (a) = 0.05. 1.)This problem is a test on what population parameter? a.Variance/ Standard Deviation b.Mean c.Population Proportion d.None of the above 2.)What is the null and alternative 3 points hypothesis? a.Ho / (theta = 22.5) , Ha: (0 # 22.5) b.Ho / (theta > 22.5) , Ha: (0 # 22.5) c.Ho / (theta < 22.5) , Ha: (theta >= 22.5) d.None of the above 3.)What are the Significance level 3 points and type of test? alpha = 0.05 two-tailed alpha = 0.95 two-tailed alpha = 0.95 one-tailed None of the above 4.)What standardized test statistic will…arrow_forward
- A survey among the workers in a large manufacturing company was taken, in order to findout from which company the workers had purchased their mobile phones, and to find outwhether the choice of mobile phone company was related to the type of worker. The resultsare shown in the table below. ls there evidence, at 5% level, that the choice of Phone Company is independent of the type ofworker?arrow_forwardThe article “Effect of Varying Solids Concentration and Organic Loading on the Performance of Temperature Phased Anaerobic Digestion Process” (S. Vandenburgh and T. Ellis, Water Environment Research, 2002:142–148) discusses experiments to determine the effect of the solids concentration on the performance of treatment methods for wastewater sludge. In the first experiment, the concentration of solids (in g/L) was 43.94 ± 1.18. In the second experiment, which was independent of the first, the concentration was 48.66 ± 1.76. Estimate the difference in the concentration between the two experiments, and find the uncertainty in the estimate.arrow_forwardThe Etruscans. Anthropologists are still trying to unravel the mystery of the origins of the Etruscan empire, a highly advanced Italic civilization formed around the eighth century B.C. in central Italy. Were they native to the Italian peninsula or, as many aspects of their civilization suggest, did they migrate from the East by land or sea? The maximum head breadth, in millimeters, of 70 modern Italian male skulls and 84 preserved Etruscan male skulls was analyzed to help researchers decide whether the Etruscans were native to Italy. The resulting data can be found on the WeissStats site. [SOURCE: N. Barnicot and D. Brothwell, “The Evaluation of Metrical Data in the Comparison of Ancient and Modern Bones.” In Medical Biology and Etruscan Origins, G. Wolstenholme and C. O’Connor, eds., Little, Brown&Co., 1959] a. Obtain normal probability plots, boxplots, and the standard deviations for the two samples. b. Based on your results from part (a), which would you be inclined to use to…arrow_forward
- In an experiment to determine the effect of ambient temperature on the emissons of oxides of nitrogen ( NOx ) of diesel trucks, 10 trucks were run at temperatures of 40°F and 80°F . The emissions, in parts per billion, are presented in the following table. Truck 40°F 80°F 1 926.5 896.7 2 851.1 857.0 3 975.5 952.1 4 1009.3 884.8 5 871.8 840.7 6 949.2 885.1 7 1006.3 885.5 8 836.5 777.8 9 837.8 850.2 10 958.9 882.1 Send data to Excel Let μ1 represent the mean emission at 40°F and =μd−μ1μ2 .Can you conclude that the mean emission differs between the two temperatures? Use the =α0.05 level of significance and the TI-84 Plus calculator to answer the following. p value ? do we reject? is there enough evidence :?arrow_forwardIn a detailed study of the productivity of a laboratory, the age distribution of its workers was analyzed, and the results were as follows, the kurtosis coefficient is equal toarrow_forwardThe aging Neotropical termites (Neocapritermes taracua) secrete a sticky, blue-colored liquid that they spew to intruding termites. The younger Neotropical termites secrete a liquid that lacks the blue component, so it is white in appearance. In an experiment that measured the toxicity of the blue substance, the researchers placed one drop of either the blue liquid or the white liquid on individuals of a second termite species, Labiotermes labralis. Of the 41 Labiotermes labralis that got the blue drop, 37 were immobilized. Of the 40 Labiotermes labralis that got the white drop, 9 were immobilized. Is the blue liquid toxic compared to the white liquid?arrow_forward
 Algebra & Trigonometry with Analytic GeometryAlgebraISBN:9781133382119Author:SwokowskiPublisher:Cengage