
STATISTICS FOR ENGR.+SCI.(LL)-W/ACCESS
4th Edition
ISBN: 9781260133295
Author: Navidi
Publisher: MCG
expand_more
expand_more
format_list_bulleted
Concept explainers
Videos
Textbook Question
Chapter 9.4, Problem 5E
The article “Genotype-Environment Interactions and Phenotypic Stability Analyses of Linseed in Ethiopia” (W. Adguna and M. Labuschagne, Plant Breeding, 2002:66–71) describes a study in which seed yields of 10 varieties of linseed were compared. Each variety was grown on six different plots. The yields, in kilograms per hectare, are presented in the following table.
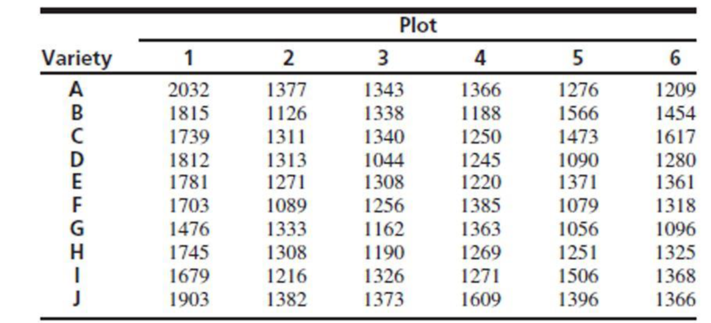
- a. Construct an ANOVA table. You may give
ranges for the P-values. - b. Can you conclude that the varieties have differing
mean yields?
Expert Solution & Answer
Want to see the full answer?
Check out a sample textbook solution
Students have asked these similar questions
An article in the Journal of Quality Technology (Vol. 13, No. 2, 1981, pp. 111–114) describes an experimentthat investigates the effects of four bleaching chemicals on pulp brightness. These four chemicals wereselected at random from a large population of potential bleaching agents. The data are as follows:a. Test the significance of these chemical types with α=0.05.b. If proven significant, perform a multiple comparison method using Fisher’s LSD
High levels of blood sugar are associated with an increased risk of type 2 diabetes. A levelhigher than normal is referred to as “impaired fasting glucose.” The article “Association ofLow-Moderate Arsenic Exposure and Arsenic Metabolism with Incident Diabetes andInsulin Resistance in the Strong Heart Family Study” (M. Grau-Perez, C. Kuo, et al.,Environmental Health Perspectives, 2017, online) reports a study in which 47 of 155 peoplewith impaired fasting glucose had type 2 diabetes. Consider this to be a simple randomsample. a) Find a 95% confidence interval for the proportion of people with impaired fasting glucose who have type 2 diabetes. b) Find a 99% confidence interval for the proportion of people with impaired fasting glucose who have type 2 diabetes. c) A doctor claims that less than 35% of people with impaired fasting glucose have type 2 diabetes. With what level of confidence can this claim be made?
On snow-covered roads, winter tires enable a car to stop in a shorter distance than if summer tires were installed. In terms of the additive model for one-way ANOVA, and for an experiment in which the mean stopping distances on a snow-covered road are measured for each of four brands of winter tires. If the data are as shown in Sheet 48, what conclusion would be reached at the 0.01 level of significance?
Shett 48
Supplier A
517
484
463
452
502
447
481
500
485
566
Supplier B
479
499
488
430
482
457
424
488
526
455
Supplier C
435
443
480
465
435
430
465
514
463
510
Supplier D
526
537
443
505
468
533
481
477
490
470
Select one:
a) p-value = 0.28 greater than 0.05, the average distance is different for at list two tires
b) F stat = 1.86, F crit = 4.38, not enough evidence to claim that the average distance is different for at list two tires
c) F ratio = 4.38, not enough evidence to claim that the average distance is different for at list two tires
d) F stat = 0.68, F…
Chapter 9 Solutions
STATISTICS FOR ENGR.+SCI.(LL)-W/ACCESS
Ch. 9.1 - A study is made of the effect of curing...Ch. 9.1 - The article Nutrient Deprivation Improves Field...Ch. 9.1 - Prob. 3ECh. 9.1 - The antibiotic gentamicin sulphate is often...Ch. 9.1 - The article influence of Age on Masonry Bond...Ch. 9.1 - Archaeologists can determine the diets of ancient...Ch. 9.1 - The article Secretion of Parathyroid Hormone...Ch. 9.1 - The article Impact of Free Calcium Oxide Content...Ch. 9.1 - A certain chemical reaction was run three times at...Ch. 9.1 - An experiment to compare the lifetimes of four...
Ch. 9.1 - Prob. 11ECh. 9.1 - Prob. 12ECh. 9.1 - Prob. 13ECh. 9.1 - Prob. 14ECh. 9.1 - Refer to Exercise 12. a. Compute the quantity...Ch. 9.1 - Prob. 16ECh. 9.1 - Prob. 17ECh. 9.1 - Prob. 18ECh. 9.1 - Prob. 19ECh. 9.1 - The following MINITAB output presents a power...Ch. 9.2 - Exercises for Section 9.2 1.The article Organic...Ch. 9.2 - The article Optimum Design of an A-pillar Trim...Ch. 9.2 - Prob. 3ECh. 9.2 - Refer to Exercise 2 in Section 9.1. a.Use the...Ch. 9.2 - Refer to Exercise 13 in Section 9.1. a. Use the...Ch. 9.2 - Refer to Exercise 1 in Section 9.1. A scientist...Ch. 9.2 - Refer to Exercise 13 in Section 9.1. A...Ch. 9.2 - Refer to Exercise 3 in Section 9.1. a. Use the...Ch. 9.2 - Refer to Exercise 5 in Section 9.1. a. Use the...Ch. 9.2 - Refer to Exercise 9 in Section 9.1. a. Use the...Ch. 9.2 - Refer to Exercise 16 in Section 9.1. a. Use the...Ch. 9.2 - Refer to Exercise 18 in Section 9.1. a. Use the...Ch. 9.2 - In an experiment to determine the effect of...Ch. 9.2 - In an experiment to determine the effect of curing...Ch. 9.2 - Prob. 15ECh. 9.2 - For some data sets, the F statistic will reject...Ch. 9.3 - To assess the effect of piston ring type and oil...Ch. 9.3 - A machine shop has three machines used in...Ch. 9.3 - An experiment to determine the effect of mold...Ch. 9.3 - The effect of curing pressure on bond strength was...Ch. 9.3 - The article Change in Creep Behavior of Plexiform...Ch. 9.3 - Prob. 6ECh. 9.3 - Prob. 7ECh. 9.3 - Adding glass panicles to clay brick may improve...Ch. 9.3 - The article Application of Radial Basis Function...Ch. 9.3 - Prob. 10ECh. 9.3 - Prob. 11ECh. 9.3 - The article Anodic Fenton Treatment of Treflan MTF...Ch. 9.3 - Refer to Exercise 12. The treatments with a...Ch. 9.3 - The article Use of Taguchi Methods and Multiple...Ch. 9.3 - The article T-Bracing for Stability of Compression...Ch. 9.3 - The article referred to in Exercise 15 also...Ch. 9.3 - Prob. 17ECh. 9.3 - Prob. 18ECh. 9.3 - The article Cellulose Acetate Microspheres...Ch. 9.4 - Recycling newsprint is important in reducing...Ch. 9.4 - A study was done to see which of four machines is...Ch. 9.4 - Prob. 3ECh. 9.4 - Three different corrosion-resistant coatings are...Ch. 9.4 - The article Genotype-Environment Interactions and...Ch. 9.4 - The article Sprinkler Technologies, Soil...Ch. 9.4 - The article Bromate Surveys in French Drinking...Ch. 9.4 - The article Multi-objective Scheduling Problems:...Ch. 9.4 - You have been given the task of designing a study...Ch. 9.4 - An engineering professor wants to determine which...Ch. 9.5 - Prob. 1ECh. 9.5 - Give an example of a factorial experiment in which...Ch. 9.5 - Prob. 3ECh. 9.5 - The article Efficient Pyruvate Production by a...Ch. 9.5 - The article cited in Exercise 4 also investigated...Ch. 9.5 - A metal casting process for the production of...Ch. 9.5 - The article An Investigation into the Ball...Ch. 9.5 - In a 2p design with one replicate per treatment,...Ch. 9.5 - Prob. 9ECh. 9.5 - Prob. 10ECh. 9.5 - The article Factorial Design for Column Rotation...Ch. 9.5 - Prob. 12ECh. 9.5 - Prob. 13ECh. 9 - The article Gypsum Effect on the Aggregate Size...Ch. 9 - Prob. 2SECh. 9 - Prob. 3SECh. 9 - Prob. 4SECh. 9 - Prob. 5SECh. 9 - Prob. 6SECh. 9 - Prob. 7SECh. 9 - The article Case Study Based Instruction of DOE...Ch. 9 - The article Combined Analysis of Real-Time...Ch. 9 - Vermont maple sugar producers sponsored a testing...Ch. 9 - Prob. 11SECh. 9 - Prob. 12SECh. 9 - Prob. 13SECh. 9 - The article Enthalpies and Entropies of Transfer...Ch. 9 - Prob. 15SECh. 9 - Prob. 16SECh. 9 - The article Factorial Experiments in the...Ch. 9 - The Williamsburg Bridge is a suspension bridge...Ch. 9 - Prob. 19SECh. 9 - In the article Nitrate Contamination of Alluvial...Ch. 9 - The article Factorial Experiments in the...Ch. 9 - Prob. 22SECh. 9 - Prob. 23SECh. 9 - Prob. 24SE
Additional Math Textbook Solutions
Find more solutions based on key concepts
2.18 Graph the relative frequency histogram for the 500 measurements summarized in the accompanying relative fr...
Statistics for Business and Economics (13th Edition)
Teacher Salaries
The following data from several years ago represent salaries (in dollars) from a school distri...
Elementary Statistics: A Step By Step Approach
Explain the procedure for obtaining the percentage of all the possible observations that lie within the specifi...
Introductory Statistics (10th Edition)
16. Singers The display shows the heights of some of the singers in a chorus, collected so that the singers cou...
STATS:DATA+MODELS-W/DVD
In Exercises 9-20, use the data in the following table, which lists drive-thru order accuracy at popular fast f...
Essentials of Statistics (6th Edition)
Fill in the blank: The probability that a fair coin lands heads is 0.5. Therefore, we can be sure that if we to...
Elementary Statistics ( 3rd International Edition ) Isbn:9781260092561
Knowledge Booster


Learn more about
Need a deep-dive on the concept behind this application? Look no further. Learn more about this topic, statistics and related others by exploring similar questions and additional content below.Similar questions
- Three samples of each of three types of PVC pipe of equal wall thickness are tested to failure under three temperature conditions, yielding the results shown below. Research questions: Is mean burst strength affected by temperature and/or by pipe type? Is there a “best” brand of PVC pipe? Burst Strength of PVC Pipes (psi) Temperature PVC1 PVC2 PVC3 Hot (70º C) 247 299 239 277 287 262 283 275 279 Warm (40º C) 325 341 297 322 319 315 296 335 304 Cool (10º C) 358 375 327 366 352 334 338 359 340 Click here for the Excel Data File (a-1) Choose the correct row-effect hypotheses. a. H0: A1 ≠ A2 ≠ A3 ≠ 0 ⇐⇐ Temperature means differ H1: All the Aj are equal to zero ⇐⇐ Temperature means are the same b. H0: A1 = A2 = A3 = 0 ⇐⇐ Temperature means are the same H1: Not all the Aj are equal to zero ⇐⇐ Temperature means differ a b (a-2) Choose the correct column-effect hypotheses. a. H0: B1 ≠ B2 ≠ B3 ≠ 0 ⇐⇐…arrow_forwardIndependent random samples of 32 people living on the west side of a city and 30 people living on the east side of a city were taken to determine if the income levels of west side residents are significantly different from the income levels of east side residents. Given the testing statistics below, determine if the data provides sufficient evidence to conclude that the income levels of west side residents are significantly different from the income levels of east side residents, at the 2% significance level. H0:μw=μeHa:μw≠μe t0=2.364 t0.01=±2.099 Select the correct answer below: No; the test statistic is not between the critical values. No; the test statistic is between the critical values. Yes; the test statistic is not between the critical values. Yes; the test statistic is between the critical values.arrow_forwardFive samples of a ferrous-type substance were used to determine if there is a difference between a laboratory chemical analysis and an X-ray fluorescence analysis of the iron content. Each sample was split into two subsamples and the two types of analysis were applied, with the accompanying results. Assuming that the populations are normal, test at the 0.10 level of significance whether the two methods of analysis give, on the average, the same result.arrow_forward
- A study, which randomly surveyed 3,700 households and drew on this information from the IRS, found that 79% of households have conducted at least one IRA rollover from an employer-sponsored retirement plan. Suppose a recent random sample of 90 households in a certain county was taken and respondents were asked whether they had ever funded an IRA account with a rollover from an employer-sponsored retirement plan. Based on the sample data below, can you conclude at the 0.10 level of significance that the proportion of households in the county that have funded an IRA with a rollover is different from the proportion for all households reported in the study? 77 respondents said they had funded an account; 13 respondents said they had notarrow_forwardDoes It Pay to Plead Guilty? The accompanying table summarizes randomly selected sample data for San Francisco defendants in burglary cases (based on data from “Does It Pay to Plead Guilty? Differential Sentencing and the Functioning of the Criminal Courts,” by Brereton and Casper, Law and Society Review, Vol. 16, No. 1). All of the subjects had prior prison sentences. Use a 0.05 significance level to test the claim that the sentence (sent to prison or not sent to prison) is independent of the plea. If you were an attorney defending a guilty defendant, would these results suggest that you should encourage a guilty plea?arrow_forwardThe article “HIV-positive Smokers Considering Quitting: Differences by Race/Ethnicity” (E. Lloyd-Richardson, C. Stanton, et al., Am J Health Behav, 2008:3–15) reported that in a group of 230 European-American HIV-positive smokers, 102 of them had used a nicotine patch to try to quit smoking, and in a group of 72 Hispanic-American HIV-positive smokers, 20 had used a nicotine patch. Can you conclude that the proportion of patch users is greater among European-Americans?arrow_forward
- A sample of 15 maple trees in Vermont were treated with one of three amounts of fertilizer, Low (group 1), Medium (group 2) and High (group 3). The volume in sap (measured in mL) produced by each tree was recorded, and a Single-Factor ANOVA test was performed, which ended up rejecting . The Summary table and the ANOVA table produced by Excel are given below: SUMMARY Groups Count Sum Average Variance Low 5 398.1 79.62 27.572 Medium 5 477.2 95.44 3.703 High 5 445.1 89.02 11.357 ANOVA Source of Variation SS df MS F Between Groups 633.0813333 2 316.5406667 22.27486395 Within Groups 170.528 12 14.21066667 Total 803.6093333 14 If you follow up the ANOVA test with a FORMAL Fisher's LSD Pairwise Comparison (PWC) test on , then use the information provided in the Excel-generated output to calculate the value of the Test Statistic (TS) that you would use to perform this PWC test. Round off your final answer to the…arrow_forwardIn analyzing the consumption of cottage cheese by members of various occupational groups, the United Dairy Industry Association found that 326 of 837 professionals seldom or never ate cottage cheese, versus 220 of 489 white-collar workers and 522 of 1243 blue-collar workers (Sheet 53). Assuming independent samples, use the 0.03 level in testing the null hypothesis that the population proportions could be the same for the three occupational groups. Sheet 53 Group 1 Group 2 Group 3 Total seldom or never 326 220 522 1068 often 511 269 721 1501 Total 837 489 1243 2569 Select one: a) chi-square stat = 4.81, crit. value = 7.01, fail to reject H0, population proportions are not different b) p-value = 0.09, reject H0, population proportions are not different c) chi-square stat = 4.81, crit. value = 9.2, fail to reject H0, population proportions are not different d) p-value = 0.029, reject H0, population proportions differentarrow_forwardConsider the following measurements of blood hemoglobin concentrations (in g/dL) from three human populations at different geographic locations: population1 = [ 14.7 , 15.22, 15.28, 16.58, 15.10 ] population2 = [ 15.66, 15.91, 14.41, 14.73, 15.09] population3 = [ 17.12, 16.42, 16.43, 17.33] For the three populations, what is the value of SSgroups in the ANOVA table? For the three populations, what is the value of SSerror in the ANOVA table?arrow_forward
- Colonoscopy is a medical procedure that is designed to find and remove precancerous lesions in the colon before they become cancerous. The article “Association of Colonoscopy and Death from Colorectal Cancer” (N. Baxter, M. Goldwasser, et al., Annals of Internal Medicine, 2009:1–8) reports that in a sample of 10,292 people diagnosed with colorectal cancer, 7.0% had previously had a colonoscopy, and in a sample of 51,460 people without colorectal cancer, 9.8% had previously had a colonoscopy. Can you conclude that the percentage of people who have had colonoscopies is greater in those without colorectal cancer?arrow_forwardIn comparing the academic performance of college students who are affiliated with fraternities and those male students who are unaffiliated, a random sample of students was drawn from each of the two populations on a university campus. Summary statistics on the student GWAs are given below. n x s Fraternity 645 2.90 0.47 Unaffiliated 450 2.88 0.42 Test, at the 1% level of significance, whether the data provide sufficient evidence to conclude that there is a difference in average GWA between the population of fraternity students and the population of unaffiliated male students on this university campus. 1. State the hypotheses. 2. Give the critical value and region of rejection. 3. Compute for the standard error of the difference between two means. 4. Compute for the test statistic. Give the probability of the calculated test statistic. 5. Interpret result using both p-value and critical region of rejection. 6. State your conclusion. 7. Construct…arrow_forwardThe one-way ANOVA partitions the total variability into into a. Sswithin and MSbetween b.Sstotal and Ssbetween c. Sswithin and ssbetween d. Sswithin and sstotalarrow_forward
arrow_back_ios
SEE MORE QUESTIONS
arrow_forward_ios
Recommended textbooks for you
 MATLAB: An Introduction with ApplicationsStatisticsISBN:9781119256830Author:Amos GilatPublisher:John Wiley & Sons Inc
 Probability and Statistics for Engineering and th...StatisticsISBN:9781305251809Author:Jay L. DevorePublisher:Cengage Learning
 Statistics for The Behavioral Sciences (MindTap C...StatisticsISBN:9781305504912Author:Frederick J Gravetter, Larry B. WallnauPublisher:Cengage Learning
 Elementary Statistics: Picturing the World (7th E...StatisticsISBN:9780134683416Author:Ron Larson, Betsy FarberPublisher:PEARSON
 The Basic Practice of StatisticsStatisticsISBN:9781319042578Author:David S. Moore, William I. Notz, Michael A. FlignerPublisher:W. H. Freeman
 Introduction to the Practice of StatisticsStatisticsISBN:9781319013387Author:David S. Moore, George P. McCabe, Bruce A. CraigPublisher:W. H. Freeman
MATLAB: An Introduction with Applications
Statistics
ISBN:9781119256830
Author:Amos Gilat
Publisher:John Wiley & Sons Inc
Probability and Statistics for Engineering and th...
Statistics
ISBN:9781305251809
Author:Jay L. Devore
Publisher:Cengage Learning
Statistics for The Behavioral Sciences (MindTap C...
Statistics
ISBN:9781305504912
Author:Frederick J Gravetter, Larry B. Wallnau
Publisher:Cengage Learning
Elementary Statistics: Picturing the World (7th E...
Statistics
ISBN:9780134683416
Author:Ron Larson, Betsy Farber
Publisher:PEARSON
The Basic Practice of Statistics
Statistics
ISBN:9781319042578
Author:David S. Moore, William I. Notz, Michael A. Fligner
Publisher:W. H. Freeman
Introduction to the Practice of Statistics
Statistics
ISBN:9781319013387
Author:David S. Moore, George P. McCabe, Bruce A. Craig
Publisher:W. H. Freeman
Statistics 4.1 Point Estimators; Author: Dr. Jack L. Jackson II;https://www.youtube.com/watch?v=2MrI0J8XCEE;License: Standard YouTube License, CC-BY
Statistics 101: Point Estimators; Author: Brandon Foltz;https://www.youtube.com/watch?v=4v41z3HwLaM;License: Standard YouTube License, CC-BY
Central limit theorem; Author: 365 Data Science;https://www.youtube.com/watch?v=b5xQmk9veZ4;License: Standard YouTube License, CC-BY
Point Estimate Definition & Example; Author: Prof. Essa;https://www.youtube.com/watch?v=OTVwtvQmSn0;License: Standard Youtube License
Point Estimation; Author: Vamsidhar Ambatipudi;https://www.youtube.com/watch?v=flqhlM2bZWc;License: Standard Youtube License