
Concept explainers
Videos
The University of Miami bookstore stocks textbooks in preparation for sales each semester. It normally relies on departmental
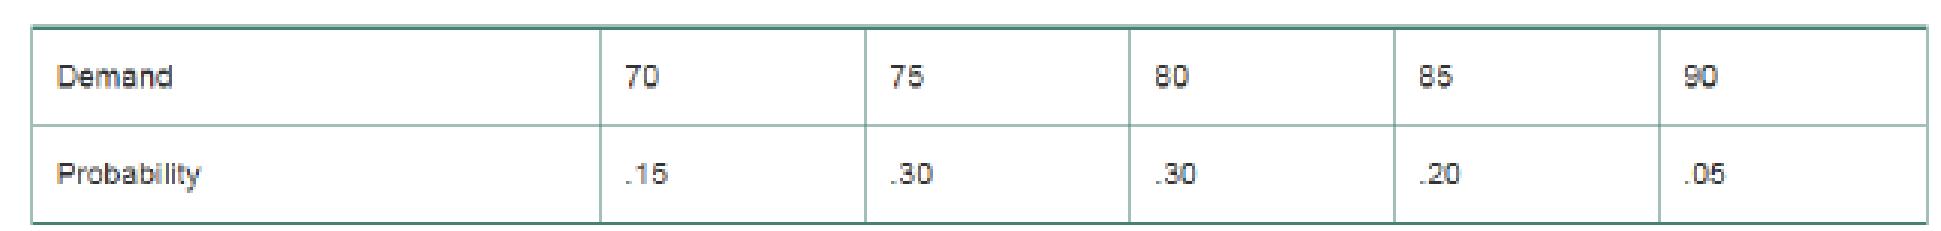
This textbook costs the bookstore $82 and sells for $112. Any unsold copies can be returned to the publisher, less a restocking fee and shipping, for a net refund of $36.
- a. Construct the table of conditional profits.
- b. How many copies should the bookstore stock to achieve highest expected value?

Trending nowThis is a popular solution!

Chapter A Solutions
MYOMLAB W/O PEARSON ETEXT--INSTANT ACCE


- W. L. Brown, a direct marketer of womens clothing, must determine how many telephone operators to schedule during each part of the day. W. L. Brown estimates that the number of phone calls received each hour of a typical eight-hour shift can be described by the probability distribution in the file P10_33.xlsx. Each operator can handle 15 calls per hour and costs the company 20 per hour. Each phone call that is not handled is assumed to cost the company 6 in lost profit. Considering the options of employing 6, 8, 10, 12, 14, or 16 operators, use simulation to determine the number of operators that minimizes the expected hourly cost (labor costs plus lost profits).arrow_forwardIt costs a pharmaceutical company 75,000 to produce a 1000-pound batch of a drug. The average yield from a batch is unknown but the best case is 90% yield (that is, 900 pounds of good drug will be produced), the most likely case is 85% yield, and the worst case is 70% yield. The annual demand for the drug is unknown, with the best case being 20,000 pounds, the most likely case 17,500 pounds, and the worst case 10,000 pounds. The drug sells for 125 per pound and leftover amounts of the drug can be sold for 30 per pound. To maximize annual expected profit, how many batches of the drug should the company produce? You can assume that it will produce the batches only once, before demand for the drug is known.arrow_forwardA new edition of a very popular textbook will be published a year from now. The publisher currently has 1000 copies on hand and is deciding whether to do another printing before the new edition comes out. The publisher estimates that demand for the book during the next year is governed by the probability distribution in the file P10_31.xlsx. A production run incurs a fixed cost of 15,000 plus a variable cost of 20 per book printed. Books are sold for 190 per book. Any demand that cannot be met incurs a penalty cost of 30 per book, due to loss of goodwill. Up to 1000 of any leftover books can be sold to Barnes and Noble for 45 per book. The publisher is interested in maximizing expected profit. The following print-run sizes are under consideration: 0 (no production run) to 16,000 in increments of 2000. What decision would you recommend? Use simulation with 1000 replications. For your optimal decision, the publisher can be 90% certain that the actual profit associated with remaining sales of the current edition will be between what two values?arrow_forward
- Play Things is developing a new Lady Gaga doll. The company has made the following assumptions: The doll will sell for a random number of years from 1 to 10. Each of these 10 possibilities is equally likely. At the beginning of year 1, the potential market for the doll is two million. The potential market grows by an average of 4% per year. The company is 95% sure that the growth in the potential market during any year will be between 2.5% and 5.5%. It uses a normal distribution to model this. The company believes its share of the potential market during year 1 will be at worst 30%, most likely 50%, and at best 60%. It uses a triangular distribution to model this. The variable cost of producing a doll during year 1 has a triangular distribution with parameters 15, 17, and 20. The current selling price is 45. Each year, the variable cost of producing the doll will increase by an amount that is triangularly distributed with parameters 2.5%, 3%, and 3.5%. You can assume that once this change is generated, it will be the same for each year. You can also assume that the company will change its selling price by the same percentage each year. The fixed cost of developing the doll (which is incurred right away, at time 0) has a triangular distribution with parameters 5 million, 7.5 million, and 12 million. Right now there is one competitor in the market. During each year that begins with four or fewer competitors, there is a 25% chance that a new competitor will enter the market. Year t sales (for t 1) are determined as follows. Suppose that at the end of year t 1, n competitors are present (including Play Things). Then during year t, a fraction 0.9 0.1n of the company's loyal customers (last year's purchasers) will buy a doll from Play Things this year, and a fraction 0.2 0.04n of customers currently in the market ho did not purchase a doll last year will purchase a doll from Play Things this year. Adding these two provides the mean sales for this year. Then the actual sales this year is normally distributed with this mean and standard deviation equal to 7.5% of the mean. a. Use @RISK to estimate the expected NPV of this project. b. Use the percentiles in @ RISKs output to find an interval such that you are 95% certain that the companys actual NPV will be within this interval.arrow_forwardAssume a very good NBA team has a 70% chance of winning in each game it plays. During an 82-game season what is the average length of the teams longest winning streak? What is the probability that the team has a winning streak of at least 16 games? Use simulation to answer these questions, where each iteration of the simulation generates the outcomes of all 82 games.arrow_forwardYou now have 10,000, all of which is invested in a sports team. Each year there is a 60% chance that the value of the team will increase by 60% and a 40% chance that the value of the team will decrease by 60%. Estimate the mean and median value of your investment after 50 years. Explain the large difference between the estimated mean and median.arrow_forward
- A common decision is whether a company should buy equipment and produce a product in house or outsource production to another company. If sales volume is high enough, then by producing in house, the savings on unit costs will cover the fixed cost of the equipment. Suppose a company must make such a decision for a four-year time horizon, given the following data. Use simulation to estimate the probability that producing in house is better than outsourcing. If the company outsources production, it will have to purchase the product from the manufacturer for 25 per unit. This unit cost will remain constant for the next four years. The company will sell the product for 42 per unit. This price will remain constant for the next four years. If the company produces the product in house, it must buy a 500,000 machine that is depreciated on a straight-line basis over four years, and its cost of production will be 9 per unit. This unit cost will remain constant for the next four years. The demand in year 1 has a worst case of 10,000 units, a most likely case of 14,000 units, and a best case of 16,000 units. The average annual growth in demand for years 2-4 has a worst case of 7%, a most likely case of 15%, and a best case of 20%. Whatever this annual growth is, it will be the same in each of the years. The tax rate is 35%. Cash flows are discounted at 8% per year.arrow_forwardDilberts Department Store is trying to determine how many Hanson T-shirts to order. Currently the shirts are sold for 21, but at later dates the shirts will be offered at a 10% discount, then a 20% discount, then a 40% discount, then a 50% discount, and finally a 60% discount. Demand at the full price of 21 is believed to be normally distributed with mean 1800 and standard deviation 360. Demand at various discounts is assumed to be a multiple of full-price demand. These multiples, for discounts of 10%, 20%, 40%, 50%, and 60% are, respectively, 0.4, 0.7, 1.1, 2, and 50. For example, if full-price demand is 2500, then at a 10% discount customers would be willing to buy 1000 T-shirts. The unit cost of purchasing T-shirts depends on the number of T-shirts ordered, as shown in the file P10_36.xlsx. Use simulation to determine how many T-shirts the company should order. Model the problem so that the company first orders some quantity of T-shirts, then discounts deeper and deeper, as necessary, to sell all of the shirts.arrow_forwardSix months before its annual convention, the American Medical Association must determine how many rooms to reserve. At this time, the AMA can reserve rooms at a cost of 150 per room. The AMA believes the number of doctors attending the convention will be normally distributed with a mean of 5000 and a standard deviation of 1000. If the number of people attending the convention exceeds the number of rooms reserved, extra rooms must be reserved at a cost of 250 per room. a. Use simulation with @RISK to determine the number of rooms that should be reserved to minimize the expected cost to the AMA. Try possible values from 4100 to 4900 in increments of 100. b. Redo part a for the case where the number attending has a triangular distribution with minimum value 2000, maximum value 7000, and most likely value 5000. Does this change the substantive results from part a?arrow_forward
- Based on Babich (1992). Suppose that each week each of 300 families buys a gallon of orange juice from company A, B, or C. Let pA denote the probability that a gallon produced by company A is of unsatisfactory quality, and define pB and pC similarly for companies B and C. If the last gallon of juice purchased by a family is satisfactory, the next week they will purchase a gallon of juice from the same company. If the last gallon of juice purchased by a family is not satisfactory, the family will purchase a gallon from a competitor. Consider a week in which A families have purchased juice A, B families have purchased juice B, and C families have purchased juice C. Assume that families that switch brands during a period are allocated to the remaining brands in a manner that is proportional to the current market shares of the other brands. For example, if a customer switches from brand A, there is probability B/(B + C) that he will switch to brand B and probability C/(B + C) that he will switch to brand C. Suppose that the market is currently divided equally: 10,000 families for each of the three brands. a. After a year, what will the market share for each firm be? Assume pA = 0.10, pB = 0.15, and pC = 0.20. (Hint: You will need to use the RISKBINOMLAL function to see how many people switch from A and then use the RISKBENOMIAL function again to see how many switch from A to B and from A to C. However, if your model requires more RISKBINOMIAL functions than the number allowed in the academic version of @RISK, remember that you can instead use the BENOM.INV (or the old CRITBENOM) function to generate binomially distributed random numbers. This takes the form =BINOM.INV (ntrials, psuccess, RAND()).) b. Suppose a 1% increase in market share is worth 10,000 per week to company A. Company A believes that for a cost of 1 million per year it can cut the percentage of unsatisfactory juice cartons in half. Is this worthwhile? (Use the same values of pA, pB, and pC as in part a.)arrow_forwardThe Tinkan Company produces one-pound cans for the Canadian salmon industry. Each year the salmon spawn during a 24-hour period and must be canned immediately. Tinkan has the following agreement with the salmon industry. The company can deliver as many cans as it chooses. Then the salmon are caught. For each can by which Tinkan falls short of the salmon industrys needs, the company pays the industry a 2 penalty. Cans cost Tinkan 1 to produce and are sold by Tinkan for 2 per can. If any cans are left over, they are returned to Tinkan and the company reimburses the industry 2 for each extra can. These extra cans are put in storage for next year. Each year a can is held in storage, a carrying cost equal to 20% of the cans production cost is incurred. It is well known that the number of salmon harvested during a year is strongly related to the number of salmon harvested the previous year. In fact, using past data, Tinkan estimates that the harvest size in year t, Ht (measured in the number of cans required), is related to the harvest size in the previous year, Ht1, by the equation Ht = Ht1et where et is normally distributed with mean 1.02 and standard deviation 0.10. Tinkan plans to use the following production strategy. For some value of x, it produces enough cans at the beginning of year t to bring its inventory up to x+Ht, where Ht is the predicted harvest size in year t. Then it delivers these cans to the salmon industry. For example, if it uses x = 100,000, the predicted harvest size is 500,000 cans, and 80,000 cans are already in inventory, then Tinkan produces and delivers 520,000 cans. Given that the harvest size for the previous year was 550,000 cans, use simulation to help Tinkan develop a production strategy that maximizes its expected profit over the next 20 years. Assume that the company begins year 1 with an initial inventory of 300,000 cans.arrow_forwardAn automobile manufacturer is considering whether to introduce a new model called the Racer. The profitability of the Racer depends on the following factors: The fixed cost of developing the Racer is triangularly distributed with parameters 3, 4, and 5, all in billions. Year 1 sales are normally distributed with mean 200,000 and standard deviation 50,000. Year 2 sales are normally distributed with mean equal to actual year 1 sales and standard deviation 50,000. Year 3 sales are normally distributed with mean equal to actual year 2 sales and standard deviation 50,000. The selling price in year 1 is 25,000. The year 2 selling price will be 1.05[year 1 price + 50 (% diff1)] where % diff1 is the number of percentage points by which actual year 1 sales differ from expected year 1 sales. The 1.05 factor accounts for inflation. For example, if the year 1 sales figure is 180,000, which is 10 percentage points below the expected year 1 sales, then the year 2 price will be 1.05[25,000 + 50( 10)] = 25,725. Similarly, the year 3 price will be 1.05[year 2 price + 50(% diff2)] where % diff2 is the percentage by which actual year 2 sales differ from expected year 2 sales. The variable cost in year 1 is triangularly distributed with parameters 10,000, 12,000, and 15,000, and it is assumed to increase by 5% each year. Your goal is to estimate the NPV of the new car during its first three years. Assume that the company is able to produce exactly as many cars as it can sell. Also, assume that cash flows are discounted at 10%. Simulate 1000 trials to estimate the mean and standard deviation of the NPV for the first three years of sales. Also, determine an interval such that you are 95% certain that the NPV of the Racer during its first three years of operation will be within this interval.arrow_forward
 Practical Management ScienceOperations ManagementISBN:9781337406659Author:WINSTON, Wayne L.Publisher:Cengage,