
College Algebra (6th Edition)
6th Edition
ISBN: 9780321916600
Author: Mark Dugopolski
Publisher: PEARSON
expand_more
expand_more
format_list_bulleted
Videos
Textbook Question
Chapter A, Problem 5E
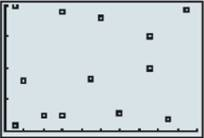
For each given
Expert Solution & Answer
Want to see the full answer?
Check out a sample textbook solution
Students have asked these similar questions
The following scatterplot shows the relationship between the amount of money spent (budget)
and the amount of money earned (gross) for the 13 Hollywood movies with the highest profit.
Gross(mil)
2000
1500-
1000
50
A. O Negative linear relationship
B. O Positive linear relationship
C. Positive nonlinear relationship
D. O Negative nonlinear relationship
100
150
Budget(mil)
200
Which of the following best describes the relationship between X(budget) and Y(gross) as it appears in the
scatterplot?
A ticket-taker at a movie theater explored the relationship between the percentage of customers that wait more than 15 minutes in line for tickets and the percent of customers that purchase snacks at the theater. The ticket taker collects information from 6 lines during a particular week, as shown in the table below.
Use the graph below to plot the points and develop a linear relationship between the percent of waiting customers and the percent of snack purchases at a movie theater.
Line
% of Waiting Customers
% of Snack Purchases
1
90
3
2
75
11
3
60
16
4
52
20
5
40
30
6
30
35
The Manager of a car plant wishes to
investigate how the plant's electricity usage
depends upon the plant's production.
Calculate the relationship between the
variables.
Chapter A Solutions
College Algebra (6th Edition)
Ch. A - True or False? Explain. A scatter diagram is a...Ch. A -
True or False? Explain.
2. If data are roughly...Ch. A -
True or False? Explain.
3. If there is no...Ch. A - True or False? Explain. The line of best fit is...Ch. A - Prob. 5FTCh. A - Prob. 6FTCh. A - Prob. 7FTCh. A - Prob. 8FTCh. A - Prob. 9FTCh. A - True or False? Explain. If we make a prediction...
Ch. A - Prob. 1ECh. A -
Fill in the blank.
2. The line that best fits the...Ch. A - Prob. 3ECh. A -
For each given scatter diagram determine whether...Ch. A - For each given scatter diagram determine whether...Ch. A - Prob. 6ECh. A -
For each given scatter diagram determine whether...Ch. A - For each given scatter diagram determine whether...Ch. A - For each given scatter diagram determine whether...Ch. A - Prob. 10ECh. A - Prob. 11ECh. A - Prob. 12ECh. A - Prob. 13ECh. A - Prob. 14ECh. A - Prob. 15ECh. A - Prob. 16ECh. A - Prob. 17ECh. A - Prob. 18ECh. A - Prob. 19ECh. A - Prob. 20ECh. A - Solve each Problem. Coal Production The amount of...Ch. A - Prob. 22ECh. A - Prob. 23ECh. A - Prob. 24ECh. A - Prob. 25ECh. A - Prob. 26ECh. A - Number of Farms The accompanying table gives the...Ch. A - Use your calculator to find the linear regression...Ch. A - Use the regression equation to estimate the cost...Ch. A - Use the regression equation to estimate the cost...
Knowledge Booster


Learn more about
Need a deep-dive on the concept behind this application? Look no further. Learn more about this topic, algebra and related others by exploring similar questions and additional content below.Similar questions
- Does Table 2 represent a linear function? If so, finda linear equation that models the data.arrow_forwardA hospital administrator wants to seeif there isa relationshipbetween the number of licensed beds and the number of staffed beds in local hospitals. The data for a specific day are shown , Describe the relationship between the variables Licensed beds x Staffed beds y 80 90 66 48 77 75 50 62 75 80arrow_forwardThe r code for side by side boxplot of vitamind v newage and vitamin d v country. Scatterplot code for relationship between vitamin d level and age.arrow_forward
- An insurance company determines that a linear relationship exists between the cost of fire damage in major residential fıres and the distance from the house to the nearest fire station. A sample of 15 recent fires in a large suburb of a major city was selected. For each fire, the following variables were recorded: x= the distance between the fire and the nearest fire station (in miles) y= cost of damage (in dollars) The distances between the fire and the nearest fire station ranged between 0.7 miles and 6.1 miles. The correlation between cost and distance is 0.961. Test if the correlation is significant at a=.10. O No, the correlation is not significant because 0.961 does not exceed the critical value. O Yes, the correlation is significant because 0.961 exceeds the critical value. No, the correlation is not significant because 0.961 exceeds the critical value. O Yes, the correlation is significant because 0.961 does not exceed the critical value. O No, the correlation is not…arrow_forwardBrandon works as a statistician for the Toronto Blue Jays, and wants to analyze the relationship between a player's age and how many strikeouts they accumulate in a season. He takes a sample of 5 Blue Jays players with age between 25 and 34 and finds there is a linear relationship between their ages and the number of strikeouts they had in the 2015 season. Here are the numerical summaries for age and the number of strikeouts: r = 0.6, age = 25.3, Sage = 3.2, strikeout = 105.7, S strikeout = 7.48 a) What is the value of b₁, the estimated slope? (Round your answer to 3 decimal places, if needed.) Answer: b) What is the value of bo, the estimated intercept? (Round your answer to 3 decimal places, if needed.) Answer: c) What is the percent of variation in the number of strikeouts that is explained by age, using linear regression? (Round your answer to 2 decimal places, if needed.) Answer: % d) Can we use this linear regression to predict the number of strikeouts for a player age at 37? No,…arrow_forwardHelp please!arrow_forward
- Brandon works as a statistician for the Toronto Blue Jays, and wants to analyze the relationship between a player's age and how many strikeouts they accumulate in a season. He takes a sample of 8 Blue Jays players with age between 25 and 34 and finds there is a linear relationship between their ages and the number of strikeouts they had in the 2015 season. Here are the numerical summaries for age and the number of strikeouts: r = 0.67, age = 28.4, Sage = 3.96, strikeout= 102.9, S strikeout = 7.7 (a) What is the value of b₁, i.e. the fitted slope? (Round your answer to 3 decimal places) Answer: (b) What the value of bo, i.e. the fitted intercept? (Round your answer to 3 decimal places.) Answer: (c) What is the percent of variation of the number of strikeouts that is explained by age using a linear regression? (Round your answer to 2 decimal places.) Answer: % (d) Can we use this linear regression to predict the number of strikeouts for a player age 38? Answer: O No, because the…arrow_forwardPage of 11 ZOOM + 5. The table shows how the cost of a carne asada taco at my favorite taco stand has increased as they have become more popular since their opening in 2013. Use the data to answer the questions below. Year, x 2013, 0 2014, 1 2015, 2 2016, 3 2017, 4 2018, 5 2019,6 Cost ($) 0.50 0.55 0.65 0.75 0.90 1.00 1.10 (a) What is the regression line given by your TI-84 for this data? Round values to 3 decimal places. (b) Using the regression equation above, predict the cost of a carne asada taco at my favorite taco stand in 2020. Show the work.arrow_forwardThe data set Pain contains hypothetical data for a clinical trial of a drug therapy to control pain. The clinical trial investigates whether adverse responses increase with larger drug doses. Subjects receive either a placebo or one of four drug doses (1, 2, 3, or 4 units). An adverse response is recorded as Adverse = 'Yes'; otherwise, it is recorded as Adverse = 'No'. The number of subjects for each drug dose and response combination is contained in the variable Count. (a) Construct a contingency table that corresponds to the data set created above. What type of variable is Dose? (B) Compute the sample proportions of adverse responses at each dose level. Do you observe any trend in the proportion of adverse responses with respect to dose level? (C) Conduct a Cochran-Armitage trend test at the 5% significance level to address the interests of the trial.arrow_forward
- A real estate agent wanted to find the relationship between sale price of houses and the size of the house. She collected data on two variables recorded in the following table for 15 houses in Seattle. The two variables are PRICE= Sale price of houses in thousands of dollars SIZE= Area of the entire house in square feet. PRICE 455 278 463 327 505 264 445 346 487 289 434 411 223 323 488 250 225 290 180 320 240 270 205 285 240 260 230 170 230 298 SIZE a) Using MICROSOFT EXCEL- run the above regression and copy the output into your assignment word document from which you can write down the least square regression line. Write down the least square regression line from that specific output. USE THE NAME OF VARIABLES WHEN YOU WRITE THE EQUATION. b) Interpret the slope and constant term with proper UNITS assigned. c) Comment on the explanatory power of the regression model from the required output. Copy that specific output into your assignment word document. Now to increase the explanatory…arrow_forwardImagine you are interning for Starbucks corporation in Seattle, WA. It is known that there is a linear relationship between the number of customers in a store and the revenue of the store. A San Francisco corporate executive at the company wants to verify this claim about all Starbucks, so they survey every Starbucks in their district of San Francisco. Match the foll the information description. ✓ [Choose ] All Coffee shops San Francisco Starbuck Stores All Starbuck coffee shops in San Francisco Population Sample Observational Unit Explanatory Variable Response Variable a Starbucks store number of customers The amount of revenue in a month All Starbucks stores A customer The revenue made in San Francisco revenue of the storearrow_forwardDraw a scatter diagram with square feet of living space as the independent variable and selling price as the dependent variable and describe variable and describe the relationship between the size of a house and the selling price.arrow_forward
arrow_back_ios
SEE MORE QUESTIONS
arrow_forward_ios
Recommended textbooks for you

 Glencoe Algebra 1, Student Edition, 9780079039897...AlgebraISBN:9780079039897Author:CarterPublisher:McGraw Hill
 Elementary Geometry For College Students, 7eGeometryISBN:9781337614085Author:Alexander, Daniel C.; Koeberlein, Geralyn M.Publisher:Cengage,
 Algebra & Trigonometry with Analytic GeometryAlgebraISBN:9781133382119Author:SwokowskiPublisher:Cengage
 Holt Mcdougal Larson Pre-algebra: Student Edition...AlgebraISBN:9780547587776Author:HOLT MCDOUGALPublisher:HOLT MCDOUGAL
 College Algebra (MindTap Course List)AlgebraISBN:9781305652231Author:R. David Gustafson, Jeff HughesPublisher:Cengage Learning
Glencoe Algebra 1, Student Edition, 9780079039897...
Algebra
ISBN:9780079039897
Author:Carter
Publisher:McGraw Hill
Elementary Geometry For College Students, 7e
Geometry
ISBN:9781337614085
Author:Alexander, Daniel C.; Koeberlein, Geralyn M.
Publisher:Cengage,
Algebra & Trigonometry with Analytic Geometry
Algebra
ISBN:9781133382119
Author:Swokowski
Publisher:Cengage
Holt Mcdougal Larson Pre-algebra: Student Edition...
Algebra
ISBN:9780547587776
Author:HOLT MCDOUGAL
Publisher:HOLT MCDOUGAL
College Algebra (MindTap Course List)
Algebra
ISBN:9781305652231
Author:R. David Gustafson, Jeff Hughes
Publisher:Cengage Learning
UG/ linear equation in linear algebra; Author: The Gate Academy;https://www.youtube.com/watch?v=aN5ezoOXX5A;License: Standard YouTube License, CC-BY
System of Linear Equations-I; Author: IIT Roorkee July 2018;https://www.youtube.com/watch?v=HOXWRNuH3BE;License: Standard YouTube License, CC-BY