
INTRO.STATISTICS,TECH.UPDT.-W/MYSTATLAB
10th Edition
ISBN: 9780135230008
Author: WEISS
Publisher: PEARSON
expand_more
expand_more
format_list_bulleted
Concept explainers
Videos
Textbook Question
Chapter A.2, Problem 43E
Advertising and Sales. A household-appliance manufacturer wants to analyze the relationship between total sales and the company's three primary means of advertising. The first three columns of the table below provide the expenditures on advertising, by type, for each of 10 randomly selected sales periods. The fourth column contains the total sales. All data are in millions of dollars. We performed a multiple
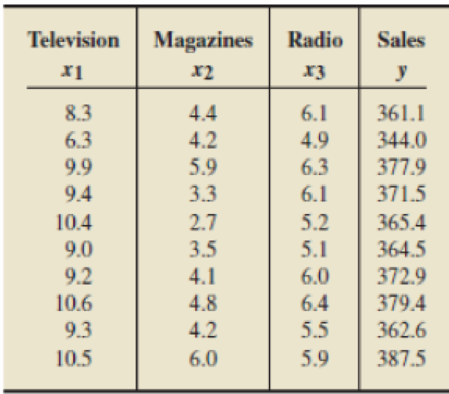
- a. Use the
scatterplot matrix in Output A.4 to assess whether a multiple linear regression model might be appropriate for predicting sales. - b. Use the computer output in Output A.5 to obtain the sample regression equation for sales in terms of television, magazine, and radio advertising expenditures.
- c. Apply the sample regression equation to predict total sales if the amounts spent on television, magazine, and radio
Expert Solution & Answer
Want to see the full answer?
Check out a sample textbook solution
Students have asked these similar questions
Use the given data to find the scatter plot, equation of the regression line, and prediction.
4) Managers rate employees according to job performance and attitude. The results for several randomly selected
employees are given below.
Performance
59 63 65 69 58 77 76 | 69 70 64
Attitude
72 67 78 82 75 87 92 83 87 78
What function do you use to see the scatterplot on the calculator.
Scatterplot from the calculator:
Spring is a peak time for selling houses. The file SpringHouses contains the selling price, number of bathrooms, square footage, and number of bedrooms of 26 homes sold in Ft. Thomas, Kentucky, in spring 2018 (realtor.com website)
Click on the datafile logo to reference the data.
DATA file
a. The Excel output for the estimated regression equation that can be used to predict the selling price given the number of bathrooms, square footage, and number of bedrooms in the house:
SUMMARY OUTPUT
Multiple R
R Square
Adjusted R Square
Standard Error
Observations
ANOVA
Regression statistics
Regression
Residual
Total
Multiple R
R Square
ANOVA
Adjusted R Square
Standard Error
Observations
0.7429
0.5519
0.4907
61948.6931
Regression statistics
Regression
Residual
Total
df
Intercept
Sq Ft
Beds
Lower 95%
0.9353 -145129.5298
Intercept
Baths
0.9528 -49383.5243
0.0180
Sq Ft
Beds
0.0326
Does the estimated regression equation provide a good fit to the data? Explain. Hint: If R is greater than 45%, the…
Interpret the slope and the y-intercept in the context of the problem.
Chapter A Solutions
INTRO.STATISTICS,TECH.UPDT.-W/MYSTATLAB
Ch. A.1 - A. 1 Regarding linear equations in two or more...Ch. A.1 - Fill in the blanks. a. The graph of a linear...Ch. A.1 - Consider a linear equation y = b0 + b1x1 + b2x2. ...Ch. A.1 - Prob. 4ECh. A.1 - Prob. 5ECh. A.1 - Prob. 6ECh. A.1 - Banquet Room Rental. The banquet room at the...Ch. A.1 - Prob. 8ECh. A.1 - In each of Exercises A.9A.12, a. determine the...Ch. A.1 - In each of Exercises A.9A.12, a. determine the...
Ch. A.1 - In each of Exercises A.9A.12, a. determine the...Ch. A.1 - In each of Exercises A.9A.12, a. determine the...Ch. A.1 - Prob. 13ECh. A.1 - Prob. 14ECh. A.1 - Prob. 15ECh. A.1 - In each of Exercises A.13A.22, you are given the...Ch. A.1 - Prob. 17ECh. A.1 - Prob. 18ECh. A.1 - In each of Exercises A.13A.22, you are given the...Ch. A.1 - Prob. 20ECh. A.1 - Prob. 21ECh. A.1 - In each of Exercises A.13A.22, you are given the...Ch. A.1 - In each of Exercises A.23A.30, we have identified...Ch. A.1 - Prob. 24ECh. A.1 - Prob. 25ECh. A.1 - Prob. 26ECh. A.1 - In each of Exercises A.23A.30, we have identified...Ch. A.1 - Prob. 28ECh. A.1 - Prob. 29ECh. A.1 - Prob. 30ECh. A.1 - Why is it often preferable to use more than one...Ch. A.1 - Grade Prediction. The Statistics Department at a...Ch. A.1 - Prob. 33ECh. A.1 - Blood Pressure Medication. A medical researcher...Ch. A.1 - Infant Mortality Rate. A social scientist wants to...Ch. A.2 - Regarding a scatterplot matrix: a. Identify two of...Ch. A.2 - Regarding the criterion used to decide tits a set...Ch. A.2 - Prob. 38ECh. A.2 - Regarding the variables in a multiple linear...Ch. A.2 - Answer true or false to the following statements...Ch. A.2 - In each of Exercises A.41 and A.42, a. construct...Ch. A.2 - In each of Exercises A.41 and A.42, a. construct...Ch. A.2 - Advertising and Sales. A household-appliance...Ch. A.2 - Corvette Prices. The data on age and price for 10...Ch. A.2 - Graduation Kales. Graduation rates and what...Ch. A.2 - Custom Home Resales. Hanna Properties specializes...Ch. A.2 - Advertising and Sales. Refer to Exercise A.43. Use...Ch. A.2 - Prob. 48ECh. A.2 - Graduation Rates. Refer to Exercise A.45. Use the...Ch. A.2 - Custom Home Resales. Refer to Exercise A.46. Use...Ch. A.3 - Fill in the blanks. a. A measure of total...Ch. A.3 - In this section we introduced a descriptive...Ch. A.3 - Suppose x1, x2, and x3 are predictor variables and...Ch. A.3 - State the four conditions required for making...Ch. A.3 - In each of Exercises A.55A.59, assume the...Ch. A.3 - In each of Exercises A.55A.59, assume the...Ch. A.3 - In each of Exercises A.55A.59, assume the...Ch. A.3 - Prob. 58ECh. A.3 - In each of Exercises A.55A.59, assume the...Ch. A.3 - Fill in the blanks. a. When a sum of squares is...Ch. A.3 - Answer true or false to the following statements...Ch. A.3 - For a particular multiple linear regression...Ch. A.3 - For a particular multiple linear regression...Ch. A.3 - Advertising and Sales. Refer to Exercise A.43 on...Ch. A.3 - Corvette Prices. Refer to Exercise A.44 on page...Ch. A.3 - Graduation Rates. Refer to Exercise A.45 on page...Ch. A.3 - Custom Home Resales. Refer to Exercise A.46 on...Ch. A.3 - Advertising and Sales. Refer to Exercise A.43 on...Ch. A.3 - Corvette Prices. Refer to Exercise A.44 on page...Ch. A.3 - Graduation Rates. Refer to Exercise A.45 on page...Ch. A.3 - Custom Home Resales. Refer to Exercise A.46 on...Ch. A.3 - Suppose that R2 = 1 for a data set. What can you...Ch. A.3 - Suppose that R2 = 0 for a data set. What can you...Ch. A.3 - Use the regression identity for multiple linear...Ch. A.4 - Explain why the predictor variables are useless as...Ch. A.4 - Prob. 76ECh. A.4 - What test statistic is used for a hypothesis test...Ch. A.4 - Answer line or false to the following statements...Ch. A.4 - Advertising and Sales. Refer to Exercise A.43 oil...Ch. A.4 - Prob. 80ECh. A.4 - Graduation Rates. Refer to Exercise A.45 on page...Ch. A.4 - Custom-Home Resales. Refer to Exercise A.46 on...Ch. A.4 - Advertising and Sales. Referring to Exercise A.79,...Ch. A.4 - Prob. 84ECh. A.4 - Graduation Rates. Referring to Exercise A.81, use...Ch. A.4 - Prob. 86ECh. A.5 - What two regression inferences did we discuss in...Ch. A.5 - Prob. 88ECh. A.5 - A sample multiple linear regression equation...Ch. A.5 - Answer true or false to the following statements...Ch. A.5 - Advertising and Sales. Refer to Exercise A.43 on...Ch. A.5 - Corvette Prices. Refer to Exercise A.44 on page...Ch. A.5 - Graduation Rates. Refer to Exercise A.45 on page...Ch. A.5 - Custom-Home Resales. Refer to Exercise A.46 on...Ch. A.5 - Advertising and Sales. Referring to Exercise A.91,...Ch. A.5 - Corvette Sales. Referring to Exercise A.92, use...Ch. A.5 - Graduation Rates. Referring to Exercise A.93, use...Ch. A.5 - Custom-Home Resales. Referring to Exercise A.94,...Ch. A.6 - Fill in the blanks. a. In multiple linear...Ch. A.6 - Describe the difference between a residual and a...Ch. A.6 - Fill in the blanks. a. In multiple linear...Ch. A.6 - Answer true or false to the following statements...Ch. A.6 - Prob. 103ECh. A.6 - Corvette Prices. Refer to Exercise A.44 on page...Ch. A.6 - Advertising and Sales. Refer to Exercise A.43 on...Ch. A.6 - Corvette Prices. Refer to Exercise A.44 on page...Ch. A.6 - Graduation Rates. Refer to Exercise A.45 on page...Ch. A.6 - Custom-Homes Resales. Refer to Exercise A.46 on...Ch. A - For a linear equation y = b0 + b1x1 + b2x2 + b3x3,...Ch. A - Consider the linear equation y = 5 + 4x1 3x2. a....Ch. A - Answer true or false to each of the following...Ch. A - What kind of plot is useful for deciding whether...Ch. A - Prob. 5RPCh. A - Prob. 6RPCh. A - Regarding multiple linear regression analysis: a....Ch. A - Prob. 8RPCh. A - For each of the following sums of squares in...Ch. A - Prob. 10RPCh. A - Prob. 11RPCh. A - Suppose x1 and x2 are predictor variables for a...Ch. A - Fill in the blanks. a. The F-statistic for a test...Ch. A - Answer true or false to each of the following...Ch. A - Which interval is wider: (a) the 95% confidence...Ch. A - What plots did we use in this module to decide...Ch. A - Regarding analysis of residuals, decide in each...Ch. A - Annual Income. The Census Bureau collects data on...Ch. A - Annual Income. Refer to Problem 18 and the...Ch. A - Annual Income. Refer to Problem 18, Outputs...Ch. A - Recall from Chapter 1 (page 34 of your text) that...Ch. A - At the beginning of this module on page A-0, we...
Knowledge Booster


Learn more about
Need a deep-dive on the concept behind this application? Look no further. Learn more about this topic, statistics and related others by exploring similar questions and additional content below.Similar questions
- Does Table 2 represent a linear function? If so, finda linear equation that models the data.arrow_forwardYou have been hired to help a large supermarket retail chain. they are trying to understand how aisle location of specialty pet food - whether specialty pet food is placed at the front or back of the aisle, and shelf space allocated to it (in square feet) affect its sales. An data analyst colleague provided the following regression analysis. Sales: weekly sales in $ (dependent variable) aisle location: 1 if the product was placed at the front of the aisle; 0 if the product was placed at the back of the aisle Shelf space: shelf space occupied by specialty pet food (in square feet) Use the attached regression analysis to answer the following questions: Question A. If two stores A and B had the same shelf space allocated to specialty pet food but store A placed this product at the front of the aisle whereas store B placed this product at the back of the aisle, which of these two stores would have higher sales of this specialty pet food? A or B? Question B Suppose that you have…arrow_forwardA candy bar manufacturer is interested in trying to estimate how sales are influenced by the price of their product. To do this, the company randomly chooses 6 small cities and offers the candy bar at different prices. Using candy bar sales as the dependent variable, the company will conduct a simple linear regression on the data below: City Price ($) Sales River Falls 1.30 100 Hudson 1.60 90 Ellsworth 1.80 90 Prescott 2.00 40 Rock Elm 2.40 38 Stillwater 2.90 32 What is the test statistics for testing the significance of correlation coefficient? a e W charrow_forward
- A candy bar manufacturer is interested in trying to estimate how sales are influenced by the price of their product. To do this, the company randomly chooses 6 small cities and offers the candy bar at different prices. Using candy bar sales as the dependent variable, the company will conduct a simple linear regression on the data below: City Price ($) Sales River City 1.30 100 Hudson 1.60 90 Ellsworth 1.80 90 Prescott 2.00 40 Rock Elm 2.40 38 Stillwater 2.90 32 What is the coefficient of correlation for these data? -0.7839 0.8854 0.7839 -0.8854arrow_forwardA candy bar manufacturer is interested in trying to estimate how sales are influenced by the price of their product. To do this, the company randomly chooses 6 small cities and offers the candy bar at different prices. Using candy bar sales as the dependent variable, the company will conduct a simple linear regression on the data below: City Price ($) Sales River City 1.30 100 Hudson 1.60 90 Ellsworth 1.80 60 Prescott 2.00 40 Rock Elm 2.40 38 Stillwater 2.90 32 What is the estimated mean change in the sales of the candy bar if price goes up by $1.00? Question 3 options: A) -48.193 B) 0.784 C) -44.58 D) 161.386arrow_forwardHow do you figure this out using conjoint analysis in a linear regression? Determine how various attributes impact the purchase of a car. There are four attributes, each with three levels: Brand: Ford = 1, Chrysler = 2, GM = 3 MPG: 15 MPG = 1, 20 MPG = 2, 25 MPG = 3 Horsepower (HP): 100 HP = 1, 150 HP = 2, 200 HP = 3 Price: $18,000 = 1, $21,000 = 2, $24,000 = 3 The nine product profiles ranked in the data file were evaluated by a consumer. (a) For this market segment, rank the product attributes from most important to least important. Below is the data provided. Brand MPG Power Price Rank 1 1 1 1 4 1 2 2 3 7 1 3 3 2 3 2 1 2 2 6 2 2 3 1 2 2 3 1 3 9 3 1 3 3 8 3 2 1 2 5 3 3 2 1 1arrow_forward
- A real estate analyst believes that the three main factors that influence an apartment's rent in a college town are the number of bedrooms, the number of bathrooms, and the apartment's square footage. For 40 apartments, she collects data on the rent (y, in $), the number of bedrooms (x1), the number of bathrooms (x2), and its square footage (X3). The following table shows a portion of the regression results. ANOVA Significance df SS MS F F gression Residual 3 5694717 1898239 50.88 4.99E-13 36 1343176 37310 Total 39 7037893 Standard Upper 95% Coefficients Error t Stat p-value_Lower 95% Intercept 300 84.0 3.57 0.0010 130.03 470.79 Bed 226 60.3 3.75 0.0006 103.45 348.17 Bath 89 55.9 1.59 0.1195 -24.24 202.77 Sqft 0.2 0.09 2.22 0.0276 0.024 0.39 What would be the rent for a 1000-square-foot apartment that has 2 bedrooms and 2 bathrooms? $840 $1,335 $1,130 $1,260arrow_forwardArmer Company is accumulating data to use in preparing its annual profit plan for the coming year. The cost behavior pattern of the maintenance costs must be determined. The accounting staff has suggested the use of linear regression to derive an equation for maintenance hours and costs. Data regarding the maintenance hours and costs for the last year and the results of the regression analysis follow: Month Maintenance Cost Machine Hours Jan. $ 4,200 480 Feb. 3,000 320 Mar. 3,600 400 Apr. 2,820 300 May 4,350 500 June 2,960 310 July 3,030 320 Aug. 4,470 520 Sept. 4,260 490 Oct. 4,050 470 Nov. 3,300 350 Dec. 3,160 340 Sum $ 43,200 4,800 Average $ 3,600 $ 400 Average cost per hour $ 9.00 a (intercept) $ 684.65 b (coefficient) 7.2884 Standard error of the estimate 34.469 R-squared 0.99724 t-value for b 60.105…arrow_forwardArmer Company is accumulating data to use in preparing its annual profit plan for the coming year. The cost behavior pattern of the maintenance costs must be determined. The accounting staff has suggested the use of linear regression to derive an equation for maintenance hours and costs. Data regarding the maintenance hours and costs for the last year and the results of the regression analysis follow: Month Maintenance Cost Machine Hours Jan. $ 4,200 480 Feb. 3,000 320 Mar. 3,600 400 Apr. 2,820 300 May 4,350 500 June 2,960 310 July 3,030 320 Aug. 4,470 520 Sept. 4,260 490 Oct. 4,050 470 Nov. 3,300 350 Dec. 3,160 340 Sum $ 43,200 4,800 Average $ 3,600 $ 400 Average cost per hour $ 9.00 a (intercept) $ 684.65 b (coefficient) 7.2884 Standard error of the estimate 34.469 R-squared 0.99724 t-value for b 60.105…arrow_forward
- Student1 Student2 Student3 Student4 Student5 Student6 Student7 Student8 Student9 Height (inch.) 63 67 68 68 69 70 71 74 75 Weight (lbs.) 140 160 140 149 165 125 235 260 190 b. Construct the equation of the regression line. c. Predict the weight of a student who is 68 inches tall.arrow_forwardThe following data show the brand, price , and the overall score for six stereo headphones that were tested by Consumer Reports (Consumer Reports website). The overall score is based on sound quality and effectiveness of ambient noise reduction. Scores range from (lowest) to (highest). The estimated regression equation for these data is , where and .arrow_forwardIn a regression model, if every data point is exactly along the regression line, thenA. the coefficient of correlation would be 0B. the coefficient of correlation would be -1 or 1C. the coefficient of determination would be 0D. the coefficient of determination would be -1arrow_forward
arrow_back_ios
SEE MORE QUESTIONS
arrow_forward_ios
Recommended textbooks for you

 Glencoe Algebra 1, Student Edition, 9780079039897...AlgebraISBN:9780079039897Author:CarterPublisher:McGraw Hill
 Holt Mcdougal Larson Pre-algebra: Student Edition...AlgebraISBN:9780547587776Author:HOLT MCDOUGALPublisher:HOLT MCDOUGAL
Glencoe Algebra 1, Student Edition, 9780079039897...
Algebra
ISBN:9780079039897
Author:Carter
Publisher:McGraw Hill
Holt Mcdougal Larson Pre-algebra: Student Edition...
Algebra
ISBN:9780547587776
Author:HOLT MCDOUGAL
Publisher:HOLT MCDOUGAL
Correlation Vs Regression: Difference Between them with definition & Comparison Chart; Author: Key Differences;https://www.youtube.com/watch?v=Ou2QGSJVd0U;License: Standard YouTube License, CC-BY
Correlation and Regression: Concepts with Illustrative examples; Author: LEARN & APPLY : Lean and Six Sigma;https://www.youtube.com/watch?v=xTpHD5WLuoA;License: Standard YouTube License, CC-BY