
Fundamentals of Statistics, Books a la Carte Edition Plus MyLab Statistics with Pearson eText -- Access Card Package (5th Edition)
5th Edition
ISBN: 9780134763699
Author: Michael Sullivan III
Publisher: PEARSON
expand_more
expand_more
format_list_bulleted
Concept explainers
Videos
Textbook Question
Chapter B.4, Problem 2AYU
In Problems 1 and 2, test whether the population proportions differ at the α = 0.05 level of significance by determining (a) the null and alternative hypotheses, (b) the test statistic, (c) the critical value, and (d) the P-value. Assume that the samples are dependent and were obtained randomly.
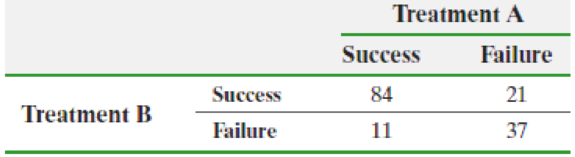
2. 
Expert Solution & Answer
Want to see the full answer?
Check out a sample textbook solution
Students have asked these similar questions
10.56 for the two breeds of hogs in problem 10.54, test the claim that hogs of breed A tend to show less variability in weight gain than hogs of breed B. Use the F-statistic computed as a fraction with one sample variance in the numerator and the other in the denominator. State the conclusion in words, and state any assumptions required for the validity test.
A researcher is interested in examining whether doctors are as accurate at diagnosing certain illnesses via telehealth as they are in person. She randomly assigns a sample of doctors to either see patients via telehealth or in person, and assesses their diagnostic accuracy.
What is the null hypothesis for scenario 2?
A) H0: µ(telehealth) = µ(in person) =µ(control)
B)Ho:μtelehealth=X¯in−person
C)H0: rxy = 0
D)H0:µTelehealth =µIn-Person
Testbank Question 9.37
Suppose you are testing the null hypothesis that a population mean is less than or equal to 46, against the alternative hypothesis that the population mean is greater than 46. If the sample size is 25, σ is known, and alpha = .01, the critical value of z is?
Chapter B.4 Solutions
Fundamentals of Statistics, Books a la Carte Edition Plus MyLab Statistics with Pearson eText -- Access Card Package (5th Edition)
Ch. B.4 - Skill Building In Problems 1 and 2, test whether...Ch. B.4 - In Problems 1 and 2, test whether the population...Ch. B.4 - NW 3. Hazardous Activities In a survey of 3029...Ch. B.4 - Income Taxes A Gallup organization survey asked...Ch. B.4 - Voice-Recognition Systems Have you ever been...Ch. B.4 - Poison Ivy Look back at the data in Table 3 on...Ch. B.4 - Gun Laws and Capital Punishment The General Social...Ch. B.4 - Children and Childcare The General Social Survey...
Knowledge Booster


Learn more about
Need a deep-dive on the concept behind this application? Look no further. Learn more about this topic, statistics and related others by exploring similar questions and additional content below.Similar questions
- I need help with problem 6. For 5 A) expected value = 1 and variance = 0.25 B) X1+X2+X3= 3 and X1*X2*X3= 1arrow_forwardQuestion 16: Test the claim that the proportion of people who own cats is larger than 50% at the 0.005 significance level.The null and alternative hypothesis would be: H0:μ=0.5H0:μ=0.5H1:μ≠0.5H1:μ≠0.5 H0:p≤0.5H0:p≤0.5H1:p>0.5H1:p>0.5 H0:μ≤0.5H0:μ≤0.5H1:μ>0.5H1:μ>0.5 H0:p=0.5H0:p=0.5H1:p≠0.5H1:p≠0.5 H0:μ≥0.5H0:μ≥0.5H1:μ<0.5H1:μ<0.5 H0:p≥0.5H0:p≥0.5H1:p<0.5H1:p<0.5 The test is: left-tailed right-tailed two-tailed Based on a sample of 200 people, 56% owned catsThe test statistic is: (to 2 decimals)The p-value is: (to 2 decimals)Based on this we: Fail to reject the null hypothesis Reject the null hypothesisarrow_forwardSuppose we have two normal populations denoted A and B, and we want to compare their population variances by estimating the ratio: variance of population B divided by variance of population A. We have an independent random sample of size 15 from population A and an independent random sample of size 9 from population B. The sample variance for population B turns out to be 30 percent larger than that for population A. What is the 99 percent confidence interval for the ratio: population variance of population B divided by population variance of population A? Use stattrek.org for finding the needed critical values.arrow_forward
- A sample of 60 items from population 1 has a sample variance of 8 while a sample of 40 items from population 2 has a sample variance of 14. If we test whether the variances of the two populations are equal, the test statistic will have a value ofarrow_forwardThe main trial in problem 7 is conducted and involves a total of 200 patients. Patients are enrolled and randomized to receive either the experimental medication or the placebo. The data shown below is collected at the end of the study after 6 weeks on the assigned treatment. Test if there is a significant difference in the proportions of hypertensive patients between groups using a=0.05arrow_forwardQuestion 12: Test the claim that the proportion of men who own cats is larger than 50% at the .005 significance level.The null and alternative hypothesis would be: H0:p=0.5H0:p=0.5H1:p≠0.5H1:p≠0.5 H0:μ=0.5H0:μ=0.5H1:μ>0.5H1:μ>0.5 H0:μ=0.5H0:μ=0.5H1:μ<0.5H1:μ<0.5 H0:μ=0.5H0:μ=0.5H1:μ≠0.5H1:μ≠0.5 H0:p=0.5H0:p=0.5H1:p<0.5H1:p<0.5 H0:p=0.5H0:p=0.5H1:p>0.5H1:p>0.5 The test is: left-tailed two-tailed right-tailed Based on a sample of 100 people, 53% owned catsThe test statistic is: (to 2 decimals)The critical value is: (to 2 decimals)Based on this we: Reject the null hypothesis Fail to reject the null hypothesisarrow_forward
- Method A: M1= 54, SS1= 400, n1= 15 Method B: M2=40, SS2= 440, n2=15 Using alpha=0.05 should the null hypothesis by rejected for the above data?arrow_forwardIf you want to carry out a statistical test at α = 0.01. to test whether the population mean is equal to 500 or not, using a sample size of 300, with a test statistic of z = 1.97, your conclusion should be: reject the null hypothesis, not enough information to determine, do not reject the null hypothesis or only reject when the test statistic is negative.arrow_forwardSuppose we take a sample of 2,500 blood donors from a population for which 50% (0.5) have type O+ blood. (a) Into what range of possible values should the sample proportion fall 95% of the time, according to the Empirical Rule? to (b) If the sample included only 625 donors instead of 2,500, would the range of possible sample proportions be wider, more narrow, or the same as with a sample of 2,500 donors? Explain your answer, and explain why it makes intuitive sense. The range would be with 625 donors compared to a sample of 2,500 donors since the standard deviation of the sampling distribution would be . This makes intuitive sense because if fewer donors are included in the sample, the proportion will be reliable as an estimate of the proportion.arrow_forward
- If X is an unknown with the only possible values 11,12,13,14, or 15, and all are equally likely as far as your information is concerned, then what is the variance of X?arrow_forwardUnder alpha 0.05 should you reject or retain the null hypothesisarrow_forwardQuestion 3. Two samples of sizes 15 and 16 are drawn from two normally distributed populations havingmeans of 16 and 11, respectively. If the sample variances are 6 and 5, determine whether the firstsample has a significantly lower variance than the second sample at a 0.025 significance level.arrow_forward
arrow_back_ios
SEE MORE QUESTIONS
arrow_forward_ios
Recommended textbooks for you
 MATLAB: An Introduction with ApplicationsStatisticsISBN:9781119256830Author:Amos GilatPublisher:John Wiley & Sons Inc
 Probability and Statistics for Engineering and th...StatisticsISBN:9781305251809Author:Jay L. DevorePublisher:Cengage Learning
 Statistics for The Behavioral Sciences (MindTap C...StatisticsISBN:9781305504912Author:Frederick J Gravetter, Larry B. WallnauPublisher:Cengage Learning
 Elementary Statistics: Picturing the World (7th E...StatisticsISBN:9780134683416Author:Ron Larson, Betsy FarberPublisher:PEARSON
 The Basic Practice of StatisticsStatisticsISBN:9781319042578Author:David S. Moore, William I. Notz, Michael A. FlignerPublisher:W. H. Freeman
 Introduction to the Practice of StatisticsStatisticsISBN:9781319013387Author:David S. Moore, George P. McCabe, Bruce A. CraigPublisher:W. H. Freeman
MATLAB: An Introduction with Applications
Statistics
ISBN:9781119256830
Author:Amos Gilat
Publisher:John Wiley & Sons Inc
Probability and Statistics for Engineering and th...
Statistics
ISBN:9781305251809
Author:Jay L. Devore
Publisher:Cengage Learning
Statistics for The Behavioral Sciences (MindTap C...
Statistics
ISBN:9781305504912
Author:Frederick J Gravetter, Larry B. Wallnau
Publisher:Cengage Learning
Elementary Statistics: Picturing the World (7th E...
Statistics
ISBN:9780134683416
Author:Ron Larson, Betsy Farber
Publisher:PEARSON
The Basic Practice of Statistics
Statistics
ISBN:9781319042578
Author:David S. Moore, William I. Notz, Michael A. Fligner
Publisher:W. H. Freeman
Introduction to the Practice of Statistics
Statistics
ISBN:9781319013387
Author:David S. Moore, George P. McCabe, Bruce A. Craig
Publisher:W. H. Freeman
Hypothesis Testing - Solving Problems With Proportions; Author: The Organic Chemistry Tutor;https://www.youtube.com/watch?v=76VruarGn2Q;License: Standard YouTube License, CC-BY
Hypothesis Testing and Confidence Intervals (FRM Part 1 – Book 2 – Chapter 5); Author: Analystprep;https://www.youtube.com/watch?v=vth3yZIUlGQ;License: Standard YouTube License, CC-BY