
Videos
Voice-Recognition Systems Have you ever been frustrated by computer telephone systems that do not understand your voice commands? Quite a bit of effort goes into designing these systems to minimize voice-recognition errors. Researchers at the Oregon Graduate Institute of Science and Technology developed a new method of voice recognition (called a remapped network) that was thought to be an improvement over an existing neural network. The data shown in the next column are based on results of their research. Does the evidence suggest that the remapped network has a different proportion of errors than the neural network? Use the α = 0.05 level of significance.
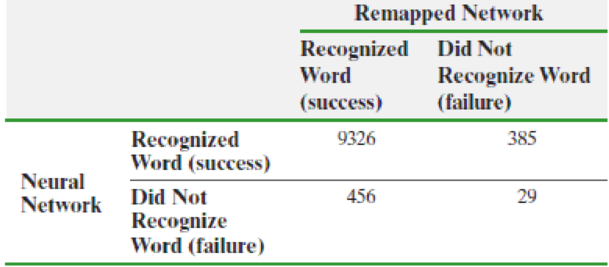
Source: Wei, Wei, Leen, Todd, Barnard, and Etienne, “A Fast Histogram-Based Postprocessor That Improves Posterior Probability Estimates.” Neural Computation 11:1235–1248.
Want to see the full answer?
Check out a sample textbook solution
Chapter B.4 Solutions
Fundamentals of Statistics (5th Edition)


- A neuroscientist is interested in testing the effects of environment on dendritic branching in the hippocampus (dendrites increase the receptivity of neurons and may be an important basis of cognition). To test this, he took one group of rats (n = 11) and housed them in an “enriched” environment (consisting of a large box with tunnels to run through, toys to play with, etc.) and then he took another group of rats (n = 11) and housed them in an “isolate” environment (rats were housed alone without any tunnels or toys). After 6 weeks, the number of dendritic spines in a particular region of the hippocampus from these rats was imaged and counted. The results are below. Did the different housing conditions have an effect on the number of dendrite branches? Solve using the steps in hypothesis testing. Enriched condition Isolate condition Mean number of dendrites 40 10 (Estimated) Standard Deviation 10 4 Question: Calculate the lower 95% confidence interval…arrow_forwardIf the Cumulative Gain at a depth of 15% for the Neural Network model is converted to number of primary/positive event cases, what will be the number of cases? Show your calculation.arrow_forwardA developmental psychologist experiment to determine if exposure to an enriched environment shortly after birth will cause increased brain development. Twenty, two-month-old rats are randomly selected from a pool of one thousand two-month-old rat pups. Ten of the twenty pups are exposed to an enriched environment for three weeks and the other ten to the usual environment for the same period of time. At a suitable time after the exposure, the psychologist measures the number of neurons per cm3 in each rat's brain. A comparison is then made of the mean number of neurons per cm3 for each group.a. What is the population?b. What is the independent variable?c. What is the sample?d. What is the statistics?e. What is the dependent variable?arrow_forward
- The extending research findings and conclusions from a study conducted on a sample population to the population at large is called? Transferability Generalizability Causality All of the abovearrow_forwardKeeping students engaged in the learning process greatly increase their chance of success in acourse. Traditional lecture-based math instruction has given way to a more student-engagedapproach where the students interact with the teacher in class and receive immediate feedbackto their responses. The teacher presence allows students, when incorrect in a response, to beguided through a solution and then immediately be given a similar problem to attempt.A researcher conducted a study to investigate whether an online homework system using anattempt-feedback-reattempt approach improved student learning over traditional pencil-andpaper homework. The online homework system was designed to increase student engagementoutside class, something commonly missing in traditional pencil-and-paper assignments,ultimately leading to increased learning.The study was conducted using two first-semester calculus classes taught by the researcher ina single semester. One class was assigned traditional homework…arrow_forwardNew "closed loop" (CL) devices have been developed to help to suppress overactive brain activity in patients with conditions such as Parkinson's disease and epilepsy.† The CL device is implanted directly into a specific area of the brain, and one of the key advantages is that it can immediately apply a treatment in reaction to heightened brain activity. This may help to reduce the duration of seizures and other periods of uncontrolled movement in patients. A study was conducted on the effectiveness of the CL device on brain activity in rats. First, each of seven rats was observed for 15 minutes with the CL device implanted but not activated (OFF). The percentage of the time that each rat was moving was recorded. Then, after each CL device was activated (CL), the percentage of the time that the rat was moving was recorded over another 15-minute period. The OFF and CL data values given in the accompanying table are approximated from a graph in the research article. The calculated…arrow_forward
- Trematodes of the species Euhaplorchis californiensis may infect the California kill fish, Fundulus parvipinnis. Researchers have observed that infected fish spend excessive time near the water surface, where they may be more vulnerable to bird predation. Researchers set up an experiment in a large outdoor tank that stocked with three kinds of killifish, uninfected, lightly infected, and highly infected, and recorded the number of fish that is eaten by birds. State the null and alternative hypothesisarrow_forward1. During courtship males of the fiddler crab sometimes build sand hoods at the entrances of their burrows, to which they attract females for mating with claw waving and other displays. Researchers are interested to determine how hoods affect male attractiveness. Researchers conducted experiments that controlled for other differences in courtship behavior between builders and nonbuilders by removing hood builders' hoods and adding hood models to nonbuilders' burrows. a) What type of research design was used by the researchers? b) Is it a type of descriptive research or inferential research? Why?arrow_forwardMotivational speakers want to be perceived as trustworthy. One hypothesis is that speakers who exhibit immediacy behaviors such as making eye contact, smiling and leaning forward might be perceived as more trustworthy than those who do not engage in these behaviors. To test this hypothesis, a psychologist obtained data from 26 participants. For people in a non-immediacy group, the speaker did not engage in any immediacy behaviors. For the immediacy group, however, the speaker made eye contact, smiled and leaned forward while giving a speech. After the speech, participants rated the speaker on a scale of trustworthiness ranging from 1 (not at all trustworthy) to 9 (highly trustworthy). The following data were obtained. Test whether the immediacy behaviors of the speaker affect trustworthiness rating. No immediacy behavior Immediacy behavior 4 4 7 4 5 3 6 5 3 5 9 8 4 6 8 7 6 3 8 6 7 5 7 8 7 6…arrow_forward
- Please Answer just D,E,F Neuroscience researchers examined the impact of environment on rat development. Rats were randomly assigned to be raised in one of the four following test conditions: Impoverished (wire mesh cage – housed alone), standard (cage with other rats), enriched (cage with other rats and toys), super enriched (cage with rats and toys changes on a periodic basis). After two months, the rats were tested on a variety of learning measures (including the number of trials to learn a maze to a three perfect trial criteria), and several neurological measure (overall cortical weight, degree of dendritic branching, etc.). The data for the maze task is below. Compute the appropriate test for the data provided in Table below Compute the appropriate test using 5% significant level. Impoverished Standard Enriched Super Enriched22 17 12 819…arrow_forwardA plant physiologist studying a small beach-dwelling plant called the Great Lakes sea rocket, Cakile edentula, wondered if the plants grew faster in competition with non-kin plants than when in competition with seedlings that are close relatives. She set up a direct study of kin recognition by growing sets of four seeds in one container. When the seedlings reached a phase of vigorous root growth, about 8 weeks after planting, she carefully removed the soil and weighed the root masses. Plants grouped with siblings had the following root weight statistics: n = 24 X = 6.25 g s = 0.47 g Plants grouped with unrelated seedlings had the following root weight statistics: n = 20 X = 7.22 g s = 0.55 g Are the plants grown in competition with unrelated individuals allocating sig- nificantly more resources to root growth than those growing among relatives?arrow_forward
 Linear Algebra: A Modern IntroductionAlgebraISBN:9781285463247Author:David PoolePublisher:Cengage Learning
 Big Ideas Math A Bridge To Success Algebra 1: Stu...AlgebraISBN:9781680331141Author:HOUGHTON MIFFLIN HARCOURTPublisher:Houghton Mifflin Harcourt