
Concept explainers
Videos
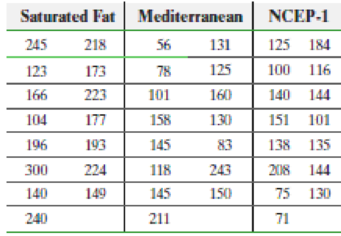
Lower Your Cholesterol Researcher Francisco Fuentes and his colleagues wanted to determine the most effective diet for reducing LDL cholesterol, the so-called “bad” cholesterol, among three diets: (1) a saturated-fat diet: 15% protein, 47% carbohydrates, and 38% fat (20% saturated fat, 12% monounsaturated fat, and 6% polyunsaturated fat); (2) the Mediterranean diet: 47% carbohydrates, and 38% fat (10% saturated fat, 22% monounsaturated fat, and 6% polyunsaturated fat); and (3) the US National Cholesterol Education Program or NCEP-1 Diet: 10% saturated fat, 12% monounsaturated fat, and 6% polyunsaturated fat. Participants in the study were shown to have the same levels of LDL cholesterol before the study and were randomly assigned to one of the three diets, or treatment groups. After 28 days, their LDL cholesterol levels were recorded. The data in the following table are based on this study.
- (a) Why is this study a completely randomized design?
- (b) What is the response variable? What is the explanatory variable that is controlled and set at three levels?
- (c) The participants were randomly assigned to one of three treatment groups. What is the purpose of randomization in this study?
- (d) State the null and alternative hypotheses.
- (e) Verify that the requirements to use the one-way ANOVA procedure are satisfied. Normal probability plots indicate that the sample data come from normal populations.
- (f) Are the mean LDL cholesterol levels different at the α = 0.05 level of significance?
- (g) Draw boxplots of the LDL cholesterol levels for the three groups to support the analytic results obtained in part (f).

Learn your wayIncludes step-by-step video

Chapter B.6 Solutions
Fundamentals of Statistics (5th Edition)
Additional Math Textbook Solutions
Elementary Statistics: Picturing the World (7th Edition)
Statistics: The Art and Science of Learning from Data (4th Edition)
Elementary Statistics (13th Edition)
Introductory Statistics (2nd Edition)
Statistics for Psychology
An Introduction to Mathematical Statistics and Its Applications (6th Edition)


- Cholesterol Cholesterol in human blood is necessary, but too much can lead to health problems. There are three main types of cholesterol: HDL (high-density lipoproteins), LDL (low-density lipoproteins), and VLDL (very low-density lipoproteins). HDL is considered “good” cholesterol; LDL and VLDL are considered “bad” cholesterol. A standard fasting cholesterol blood test measures total cholesterol, HDL cholesterol, and triglycerides. These numbers are used to estimate LDL and VLDL, which are difficult to measure directly. Your doctor recommends that your combined LDL/VLDL cholesterol level be less than 130 milligrams per deciliter, your HDL cholesterol level be at least 60 milligrams per deciliter, and your total cholesterol level be no more than 200 milligrams per deciliter. (a) Write a system of linear inequalities for the recommended cholesterol levels. Let x represent the HDL cholesterol level, and let y represent the combined LDL VLDL cholesterol level. (b) Graph the system of inequalities from part (a). Label any vertices of the solution region. (c) Is the following set of cholesterol levels within the recommendations? Explain. LDL/VLDL: 120 milligrams per deciliter HDL: 90 milligrams per deciliter Total: 210 milligrams per deciliter (d) Give an example of cholesterol levels in which the LDL/VLDL cholesterol level is too high but the HDL cholesterol level is acceptable. (e) Another recommendation is that the ratio of total cholesterol to HDL cholesterol be less than 4 (that is, less than 4 to 1). Identify a point in the solution region from part (b) that meets this recommendation, and explain why it meets the recommendation.arrow_forwardAn analyst in the real estate business is interested in the relationship between the cost of the monthly rent of an apartment and the size of an apartment, in big cities. She gathers data for apartment buildings in 12 cities in 12 different states. In each city, she gets the numbers for at least 5 different buildings and at least 40 apartments in each building. She reaches the following conclusion: the rental cost of a 2-bedroom apartment is 50% more than the rental cost of a 1-bedroom apartment, and the rental cost of a 3-bedroom apartment is 50% more than the rental cost of a 2-bedroom apartment. Based on the paragraph, what is the minimum number of apartments she collected data on? Do you think her sample was large enough to be statistically valid? Based on the paragraph, are there any apartments or apartment buildings that she would have excluded from her study? Do you see any bias in how she selected apartments for her study? Based on the paragraph, is there a positive…arrow_forwardIn a study of exhaust emissions from school buses, the pollution intake by passengers was determined for a sample of nine school buses used in the Southern California Air Basin. The pollution intake is the amount of exhaust emissions, in grams per person per million grams emitted, that would be inhaled while traveling on the bus during its usual 18-mile18-mile trip on congested freeways from South Central LA to a magnet school in West LA. (In comparison, a city of 11 million people will inhale a total of about 1212 grams of exhaust per million grams emitted.) The amounts for the nine buses when driven with the windows open are given in the table. 1.15 0.33 0.40 0.33 1.35 0.38 0.25 0.40 0.35 A good way to judge the effect of outliers is to do your analysis twice, once with the outliers and a second time without them. Give the 90%90% confidence interval with all the data for the mean pollution intake among all school buses used in the Southern California Air Basin that…arrow_forward
- The sales manager of a large automotive parts distributor wants to estimate the total annual sales for each of the company’s regions. Three factors appear to be related to regional sales: the number of retail outlets in the region, the total personal income of the region, and the number of cars registered in the region. The following table shows the data for 10 regions that were gathered for last year sales. The excel data file for this problem is:final exam question 6B spring 2021.xlsx Region Annual sales ($ million) Number of retail outlets Number of automobiles registered (million) Personal income ($ billion) 1 37.702 1,739 9.27 85.4 2 24.196 1,221 5.86 60.7 3 32.055 1,846 8.81 68.1 4 3.611 120 4.81 20.1 5 17.625 1,096 10.31 33.8 6 45.919 2,290 11.62 95.1 7 29.600 1,687 8.96 69.3 8 8.114 241 6.28 16.5 9 20.116 649 7.77 34.9 10 12.994 1,427 10.92…arrow_forwardA U.S. magazine, Consumer Reports, carried out a survey of the calorie and sodium content of a number of different brands of hotdog. There were two types of hotdog: beef, ’meat‘ (mainly pork and beef but can contain up to 15% poultry) and poultry. The results below are the calorie content of the different brands of beef and poultry hotdogs. Beef hotdogs: 186,181,176,149,184,190,158,139,175,148,152,111,141,153,190,157,131,149,135,132 Poultry hotdogs: 129,132,102,106,94,102,87,99,170,113,135,142,86,143,152,146,144 Using six steps of hypothesis testing, determine if there is a strong evidence that the calorie content of poultry hotdogs is lower than the calorie content of beef hotdogs.arrow_forwardA study shows that 80% of the population was vaccinated against the Venusian flu but 2% of the vaccinated population got the flu anyway. If 10% of the total population got this flu, what percent of the population either got the vaccine or got the disease?arrow_forward
- (b) Tiffany obtained data about the gross domestic product (GDP) and the birth rate for 170 countries. She classified each GDP and each birth rate as either "low", "medium" or "high". There were 74 countries that had a medium GDP and 43 countries that had a high GDP. Among the countries that have 58 low birth rate, there were 3 countries that have a low GDP and 20 countries that have a medium GDP, whereas among the countries that have high birth rate, there were 45 countries that have a low GDP, 12 countries have a medium GDP and no country has a high GDP. i. Construct a contingency table to represent the information above. One of these countries is chosen at random. Find the probability that The country chosen has a low GDP or a medium birth rate. ii. iii. The country chosen has a low birth rate, given that it does not have a medium GDP. iv. States with a reason whether or not the events 'the country chosen has a medium GDP' and 'the country chosen has a medium birth rate' are…arrow_forwardThe medical researcher is comparing two treatments for fighting a common cold: Zinc and Vitamin C. The researcher wants to see if the patients who take Zinc have less success fighting the common cold compared to a patients taking vitamin C. Arandom sample of some patients who take Zinc and others who took Vitamin C. The results of how many felt better the following day after experiencing symptoms of the common cold: Data on Symptoms from Taking Zinc and Vitamin C for the Common Cold Vitamin Zinc Less 342 Symptoms 553 No 225 319 Difference What can be concluded at the a = 0.05 level of significance? For this study, we should use z-test for the difference between two population proportions a. The null and alternative hypotheses would be: Ho: p1 Select an answer v p2 H1: p1 Select an answer v p2 b. The test statistic ?v = (please round your answer to 3 decimal places.) c. The p-value = (Please round your answer to 4 decimal places.) d. The p-value is [? v a e. Based on this, we should…arrow_forwardEnergy Corporation had 2,600,000 electricity customers. Of these, 85.0% were in the residential category (R); 12% were commercial (C); 1.6% were industrial (I); and 1.4% were government and municipal (G). What is the value of P(R or C') and P(G' and I)?arrow_forward
- Overhead Door (OD) Corporation’s founder, C. G. Johnson, invented the upward-lifting garage door in 1921 and the electric garage door opener in 1926. Since then OD has been a leading supplier of commercial, industrial, and residential garage doors sold through a nationwide network of more than 450 authorized distributors. They have built a solid reputation as a premier door supplier, commanding 15 % share of the market. Suppose that customers assess door quality first in terms of the ease of operation, followed by its durability. The quality improvement team (QIT) might then assign an engineering team to determine the factors that contribute to these two main problems. Smooth operation of a garage door is a critical quality characteristic that affects both problems: If a door is too heavy, it’s difficult and unsafe to balance and operate; if it’s too light, it tends to buckle and break down frequently or may not close properly. Suppose the design engineers determine that a standard…arrow_forwardLeRoy, a starting player for a major college basketball team, made only 40% of his free throws last season. During the summer, he worked on developing a softer shot in hopes of improving his free throw accuracy. In the first eight games of this season, LeRoy made 25 free throws in 40 attempts. You want to investigate whether LeRoy's work over the summer will result in a higher proportion of free-throw successes this season. What conclusion would you draw about LeRoy's free throw shooting? Justify your answer with a complete significance test. → BIU AAI E xx, 12pt Paragraph D&&arrow_forwardI am determining how effective a Drug is at reducing inflammation in individuals infected with a virus. the serum levels of antibody are measured as a measure of inflammation (less antibodies means less inflammation which decreases virus mortality) in 30 people given placebo, 30 people given 1 unit of the drug, and 30 people given 2 units of the drug. I would like to determine what levels of the drug are effective, and if there are sex-specific effects. What are the dependent and independent variables in this experiment? age _________ sex __________ antibody level _____________ treatment ___________arrow_forward
