
Videos
In each of Exercises C.168–C.I74, determine whether the number of observations is large enough to use Friedman 's test as given in Procedure C.6 on page C-102. If the number of observations is large enough, apply that procedure to perform a Friedman test at the 5% significance level using either the critical-value approach or the P-value approach.
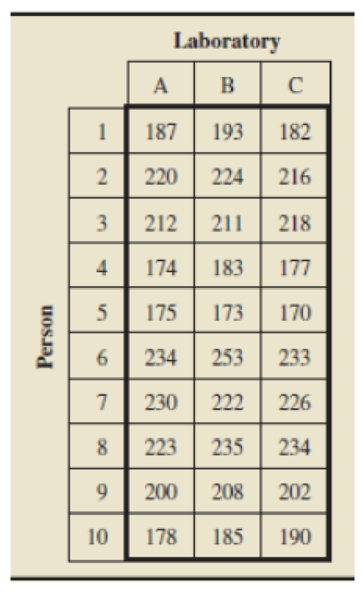
C.168 Cholesterol Testing. A large health care organization uses three laboratories for the routine analysis of blood samples. It is important that the three labs provide equivalent lest results. To check that, blood samples are obtained from 10 randomly selected individuals; each blood sample is then divided into three blood subsamples of equal volume; and then the three blood subsamples from each person are sent to different labs, For this problem, the analysis is confined to assessing the measurement of the total cholesterol level for a person. The data are in the following table.
Want to see the full answer?
Check out a sample textbook solution
Chapter C Solutions
Introductory Statistics, Books a la Carte Plus NEW MyLab Statistics with Pearson eText -- Access Card Package (10th Edition)


- What is meant by the sample space of an experiment?arrow_forwardJoan's Nursery specializes in custom-designed landscaping for residential areas. The estimated labor cost associated with a particular landscaping proposal is based on the number of plantings of trees, shrubs, and so on to be used for the project. For cost-estimating purposes, managers use two hours of labor time for the planting of a medium-sized tree. Actual times from a sample of 10 plantings during the past month follow (times in hours).arrow_forwardTourism is extremely important to the economy of Florida. Hotel occupancy is an often-reported measure of visitor volume and visitor activity (Orlando Sentinel, May 19, 2018). Hotel occupancy data for February in two consecutive years are as follows. Current Year 1,394 1,700 Occupied Rooms Total Rooms a. Formulate the hypothesis test that can be used to determine whether there has been an increase in the proportion of rooms occupied over the one-year period. Let p₁ = population proportion of rooms occupied for current year P2 = population proportion of rooms occupied for previous year 0.82 Previous Year 1,404 1,800 Ho: P1 P2 less than or equal to 0 Ha P₁ P2 greater than 0 b. What is the estimated proportion of hotel rooms occupied each year (to 2 decimals)? Current year Previous Year c. Conduct a hypothesis test. What is the p-value (to 4 decimals)? Use Table 1 from Appendix B. 0.78arrow_forward
- Which research design studies only people who are initially free of the disease of interest? Explain how this study design is different from the rest of the research designs a. Case control b. Cohort c. Cross sectional d. Experimentalarrow_forwardWhat statistical analysis could be used to determine whether the unsuccessful dieters attained a significantly different percentage from their weight-loss goal, on average, than did the successful dieters? single-sample t test In which of the following four categories does this situation fall? a. only scale variables b. nominal independent variables, scale dependent variable c. only nominal variables d. any ordinal variables (that cannot be treated as nominal)arrow_forwardIndicate the most appropriate statistical analysis method for situations a - d below. a) Measurement of blood pressure in 4 groups of patients. b) Measurement of cholesterol before and after a patient has taken a drug to lower cholesterol. Ie. 2 measurements on each patient. (c) Comparison between the number of persons who have or do not have a disease of the circulatory system and their diet classified into one of three categories: vegetarian, mixed meat and vegetables and most meat. d) Measurement of how much weight affects the concentration of glucose in the blood.arrow_forward
- The General Social Survey (GSS) collects data on demographics, eduction and work, among many other characteristics of US residents. Suppose we want to estimate the difference between the average number of hours worked by all Americans with a college degree and those without a college degree. Is there sufficient evidence that there is a significant difference between the average number of hours worked by those Americans with a college degree vs. those Americans without a college degree? Use the following output: Welch Two Sample t-testdata: yes and not = 3.1181, df = 1098.5, p-value = 0.001867alternative hypothesis: true difference in means is not equal to 095 percent confidence interval: 1.011652 4.445822sample estimates:mean of x mean of y 42.81574 40.08701 Using the provided output, find the 95% confidence interval for the difference of the average amount of hours worked for those that have a college degree vs. those that do not have a college degree (ie: for the difference of two…arrow_forwardSuppose we are testing the hypothesis that occurrence of five types of viruses (A, B, C, D and E) is independent of the climate (hot, moderate, and cold). The chi-square test statistic was 10.6. What is the P-value?arrow_forwardBelsky, Weinraub, Owen, and Kelly (2001) reportedon the effects of preschool child care on the development of young children. One result suggests thatchildren who spend more time away from their mothers are more likely to show behavioral problems inkindergarten. Using a standardized scale, the average rating of behavioral problems for kindergartenchildren is m 5 35. A sample of n 5 16 kindergartenchildren who had spent at least 20 hours per week inchild care during the previous year produced a meanscore of M 5 42.7 with a standard deviation of s 5 6.a. Are the data sufficient to conclude that childrenwith a history of child care show significantly morebehavioral problems than the average kindergartenchild? Use a one-tailed test with a 5 .01.b. Compute the 90% confidence interval for the meanrating of behavioral problems for the population ofarrow_forward
 Glencoe Algebra 1, Student Edition, 9780079039897...AlgebraISBN:9780079039897Author:CarterPublisher:McGraw Hill
 College Algebra (MindTap Course List)AlgebraISBN:9781305652231Author:R. David Gustafson, Jeff HughesPublisher:Cengage Learning