
Intro Stats (5th Edition)
5th Edition
ISBN: 9780134210223
Author: Richard D. De Veaux, Paul F. Velleman, David E. Bock
Publisher: PEARSON
expand_more
expand_more
format_list_bulleted
Concept explainers
Videos
Textbook Question
Chapter CR, Problem 7E
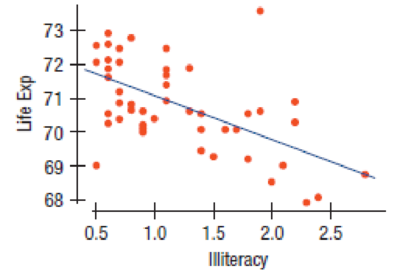
Life expectancy and literacy Consider the relationship between the life expectancy (in years) and the illiteracy rate (per hundred people) in the 50 U.S. states plus Washington, DC. A linear model is run and the output is presented here:
Coefficients:
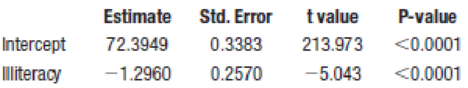
Residual standard deviation: 1.097 on 48 degrees of freedom Multiple R-squared: 0.3463,
- a) Colorado has an illiteracy rate of 0.70. What is its predicted life expectancy?
- b) Based on the analysis, which of the following can you conclude about this relationship?
- i. Reducing illiteracy will increase life expectancy.
- ii. Reducing illiteracy will reduce life expectancy.
- iii. If you move to a state that spends less money on teachers, your life expectancy will go down, on average, due to lurking variables.
- iv. Higher levels of illiteracy are associated with generally lower life expectancies.
- v. States with lower life expectancies generally have lower illiteracy rates.
- vi. None of the above
- c) What is the
correlation between life expectancy and illiteracy? - d) Tennessee’s illiteracy rate is about 1 SD above the
mean for all states. What do you predict its life expectancy to be?- i. About 1.296 SDs below the mean life expectancy.
- ii. About 1 SD below the mean life expectancy.
- iii. About 1 SD above the mean life expectancy.
- iv. About 0.59 SD below the mean life expectancy.
- v. None of the above
- e) High school graduation rate has a correlation of 0.60 with life expectancy. A simple regression of life expectancy on high school graduation rate shows a positive slope with a very low P-value. If you add high school graduation rate as a predictor to the regression of life expectancy on illiteracy, and fit a multiple regression on high school graduation and Illiteracy, which of the following is true?
- i. The R2 of this model is at least as high as the R2 of either single predictor model.
- ii. The slope of the high school graduation rate is positive.
- iii. The slope of the high school graduation rate is negative.
- iv. The slope of the high school graduation rate is statistically significant.
- i. None of the above
Expert Solution & Answer
Want to see the full answer?
Check out a sample textbook solution
Chapter CR Solutions
Intro Stats (5th Edition)
Ch. CR - Speed and density The following data relate...Ch. CR - Hospital variables A random sample of 1000...Ch. CR - Lake source cooling Since 2000, Cornell University...Ch. CR - Life expectancy and literacy Consider the...Ch. CR - Hotel maids A Harvard psychologist recruited 75...Ch. CR - Now lets consider only the maids who were...Ch. CR - Prob. 10ECh. CR - Prob. 11ECh. CR - But maybe the BMIs of all the participants changed...Ch. CR - For each of the following descriptions, select the...
Knowledge Booster


Learn more about
Need a deep-dive on the concept behind this application? Look no further. Learn more about this topic, statistics and related others by exploring similar questions and additional content below.Similar questions
- Life Expectancy The following table shows the average life expectancy, in years, of a child born in the given year42 Life expectancy 2005 77.6 2007 78.1 2009 78.5 2011 78.7 2013 78.8 a. Find the equation of the regression line, and explain the meaning of its slope. b. Plot the data points and the regression line. c. Explain in practical terms the meaning of the slope of the regression line. d. Based on the trend of the regression line, what do you predict as the life expectancy of a child born in 2019? e. Based on the trend of the regression line, what do you predict as the life expectancy of a child born in 1580?2300arrow_forwardNoise and Intelligibility Audiologists study the intelligibility of spoken sentences under different noise levels. Intelligibility, the MRT score, is measured as the percent of a spoken sentence that the listener can decipher at a cesl4ain noise level in decibels (dB). The table shows the results of one such test. (a) Make a scatter plot of the data. (b) Find and graph the regression line. (c) Find the correlation coefficient. Is a linear model appropriate? (d) Use the linear model in put (b) to estimate the intelligibility of a sentence at a 94-dB noise level.arrow_forward
Recommended textbooks for you
 Functions and Change: A Modeling Approach to Coll...AlgebraISBN:9781337111348Author:Bruce Crauder, Benny Evans, Alan NoellPublisher:Cengage Learning
 Algebra and Trigonometry (MindTap Course List)AlgebraISBN:9781305071742Author:James Stewart, Lothar Redlin, Saleem WatsonPublisher:Cengage Learning
 College AlgebraAlgebraISBN:9781305115545Author:James Stewart, Lothar Redlin, Saleem WatsonPublisher:Cengage Learning
 Linear Algebra: A Modern IntroductionAlgebraISBN:9781285463247Author:David PoolePublisher:Cengage Learning
 Glencoe Algebra 1, Student Edition, 9780079039897...AlgebraISBN:9780079039897Author:CarterPublisher:McGraw Hill
 Algebra & Trigonometry with Analytic GeometryAlgebraISBN:9781133382119Author:SwokowskiPublisher:Cengage
Functions and Change: A Modeling Approach to Coll...
Algebra
ISBN:9781337111348
Author:Bruce Crauder, Benny Evans, Alan Noell
Publisher:Cengage Learning
Algebra and Trigonometry (MindTap Course List)
Algebra
ISBN:9781305071742
Author:James Stewart, Lothar Redlin, Saleem Watson
Publisher:Cengage Learning
College Algebra
Algebra
ISBN:9781305115545
Author:James Stewart, Lothar Redlin, Saleem Watson
Publisher:Cengage Learning
Linear Algebra: A Modern Introduction
Algebra
ISBN:9781285463247
Author:David Poole
Publisher:Cengage Learning
Glencoe Algebra 1, Student Edition, 9780079039897...
Algebra
ISBN:9780079039897
Author:Carter
Publisher:McGraw Hill
Algebra & Trigonometry with Analytic Geometry
Algebra
ISBN:9781133382119
Author:Swokowski
Publisher:Cengage
Correlation Vs Regression: Difference Between them with definition & Comparison Chart; Author: Key Differences;https://www.youtube.com/watch?v=Ou2QGSJVd0U;License: Standard YouTube License, CC-BY
Correlation and Regression: Concepts with Illustrative examples; Author: LEARN & APPLY : Lean and Six Sigma;https://www.youtube.com/watch?v=xTpHD5WLuoA;License: Standard YouTube License, CC-BY