
Videos
America is getting older. The graph shows the projected elderly U.S. population for ages 65-84 and for ages 85 and older.
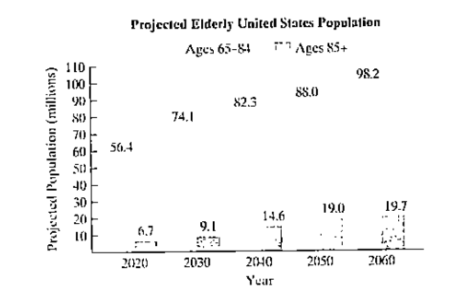
Source: U.S. Census Bureau
The formula
a. Use the formula to find the projected increase in the number of Americans ages 65-84. in millions, from 2030 to 2060. Express this difference in simplified radical form.
b. Use a calculator and write your answer in part (a) to the nearest tenth. Does this rounded decimal overestimate or underestimate the difference in the projected data shown by the bar graph on the previous page? By how much?
Want to see the full answer?
Check out a sample textbook solution
Chapter P Solutions
EP COLLEGE ALG.MYLAB W/ETEXT -W/ACCESS
Additional Math Textbook Solutions
Elementary Algebra
Algebra And Trigonometry (11th Edition)
Introductory Algebra for College Students (7th Edition)
Algebra: Structure And Method, Book 1
A Graphical Approach to College Algebra (6th Edition)


- Heart Disease In a certain country, the number of deaths due to heart disease decreased from 235 in one year to 221 in the next year. What percentage decrease in deaths due to heart disease does this represent?arrow_forwardTable 6 shows the year and the number ofpeople unemployed in a particular city for several years. Determine whether the trend appears linear. If so, and assuming the trend continues, in what year will the number of unemployed reach 5 people?arrow_forwardIn 1993, the cost of a painting was about $10. In 2002, the cost was $20. If the cost is growing exponentially, predict the cost of the painting in 2017. Round to the nearest cent. = _____arrow_forward
- arget's annual revenue data from 2005 to 2021 are available for download. Make an Excel graph of the annual data, and fit three trends (linear, quadratic, and exponential) to the time series. Copy and paste the graph in the space below or attach the file. State the three trendline equations from part a and their R2 values. Which trend model do you think is the best one to use to forecast annual revenue? Choose only one model and explain the reasons for your choice. Use the model you chose in part c to forecast the annual revenue for 2022. Annual Operating Income Year t (Millions of US $) 2005 1 46839 2006 2 52620 2007 3 59490 2008 4 63367 2009 5 64948 2010 6 65357 2011 7 67390 2012 8 69865 2013 9 73301 2014 10 71279 2015 11 72618 2016 12 73785 2017 13 70271 2018 14 72714 2019 15 75356 2020 16 78112 2021 17 93561arrow_forwardA $3,000 personal computer loses half its value every year since it was purchased. Write the equation for the exponential relation compares the computer's value to the number of years since purchase.arrow_forwardAnswer questions d,e and farrow_forward
- Population of Texas Texas was the third fastest growing state in the United States in 2016. Texas grew from 25.1 million in 2010 to 26.47 million in 2016. Use an exponential growth model to predict the population of Texas in 2025.arrow_forwardCollege students are graduating with the highest debt burden in history. The bar graph shows the mean, or average, student-loan debt in the United States for five selected graduating years from 2001 through 2013. Here are two mathematical models for the data shown by the graph. In each formula, D represents mean student-loan debt, in dollars, x years after 2000. The Model 1 is, D = 1188x + 16,218 and the Model 2 is D = 46x2 + 541x + 17,650. Solve, a. Which model better describes the data for 2001?b. Does the polynomial model of degree 2 underestimate or overestimate the mean student-loan debt for 2013? By how much?arrow_forwardFind a graph or bar chart that represents a real situation where you could use a linear or exponential equation to model the data. Identify the type of function that is being modeled and why you believe it to be this type. Estimate the equation for the function.arrow_forward
- The accompanying data represent the yearly amount of solar power installed (in megawatts) in a particular area from 2000 through 2008. The trend forecasting equations below were found, where X is the number of years after 2000. Complete parts (a) through (d) below. = -10.711 +28.9000X₁ ₁ = 22.70 +0.259X; +3.5801X? Click the icon to view the data table. a. Compute the standard error of the estimate (Syx) for each model. Linear Quadratic Syx 22.431 8.032 (Round to three decimal places as needed.) b. Compute the MAD for each model. Linear Quadratic MAD 64.222 66.873 (Round to three decimal places as needed.) c. On the basis of (a) and (b) and the principle of parsimony, which forecasting model would you select? The model with the smallest values of Syx and MAD should be used, which is the quadratic model.arrow_forwardAn online clothing company is monitoring online sales. Each month, the sales increase by 100$. Which type of model would best fit the data?arrow_forwardYou buy a new car that cost $25,000. The car depreciates at a rate of 11% per year.Write an equation to represent the exponential function of the scenario. Also identify the following: a) Independent variable b) Dependent variable c) Domain d) Range e) Starting point f) Growth/decay rate 3. Create a table to represent the exponential function. The table will have the year in the left column and the value for that year in the right column. Years 1, 5, and 10 must be included with 10 the maximum year. Including all 10 years will make it easier to plot the graph 4. List the growth or decay rate which is given in the problem you select. Is it a positive or negative rate? 5. Your equation will have two letters which are the variables. Which is the independent variable? This is the one you specify to determine the value of the other variable which is the dependent variable? 6. You will start your graph where it crosses the vertical axis which will be the value for year 0. What is that value…arrow_forward
 Glencoe Algebra 1, Student Edition, 9780079039897...AlgebraISBN:9780079039897Author:CarterPublisher:McGraw Hill
 Functions and Change: A Modeling Approach to Coll...AlgebraISBN:9781337111348Author:Bruce Crauder, Benny Evans, Alan NoellPublisher:Cengage Learning
 Holt Mcdougal Larson Pre-algebra: Student Edition...AlgebraISBN:9780547587776Author:HOLT MCDOUGALPublisher:HOLT MCDOUGAL
 Trigonometry (MindTap Course List)TrigonometryISBN:9781337278461Author:Ron LarsonPublisher:Cengage Learning