
Concept explainers
Videos
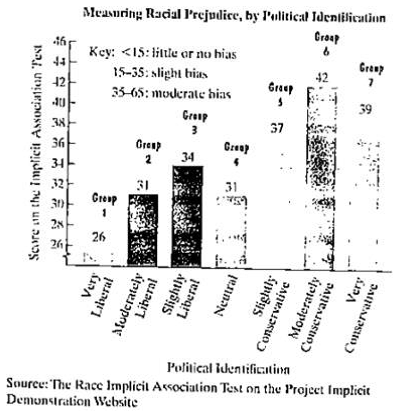
The bar graph shows the differences among political identification groups on the Implicit Association Test that measure levels of racial prejudice. Higher scores indicate stronger bias.
a. The data can be described by the following polynomial model of degree 3:
S = −0.02x3 + 0.4x2 + 1.2x + 22 + (−0.01x3 – 0.2x2 + 1.1x + 2).
In this polynomial model, S represents the score on the Implicit Association Test for political identification group x. Simplify the model.
b. Use the simplified form of the model from part (a) to find the score on the Implicit Association Test for the slightly conservative political identification group. Does the model underestimate or overestimate the score displayed by the bar graph? By how much?
Want to see the full answer?
Check out a sample textbook solution
Chapter P Solutions
EP COLLEGE ALG.MYLAB W/ETEXT -W/ACCESS
Additional Math Textbook Solutions
College Algebra (Collegiate Math)
Intermediate Algebra for College Students (7th Edition)
College Algebra Essentials (5th Edition)
High School Math 2012 Common-core Algebra 1 Practice And Problem Solvingworkbook Grade 8/9
Algebra And Trigonometry (11th Edition)
Elementary Algebra: Concepts and Applications (10th Edition)


- Find y(4.5) if a second-degree polynomial is fitted to the following data: (0, 3), (1, 6), (2, 8), (3, 11), (4, 13), (5, 14)arrow_forwardConstruct the polynomial for the data table function shownarrow_forwardQU/ Fit a second order polynomial to the data in the following table : 1 Y 4 8 9 11 13 9arrow_forward
- Determine the least possible degree of the polynomial function shown. y -5 -4 -3 -2 -1 1 4 5 -하 2.arrow_forwardThe Brazilian Amazon rain forest is the world’s largest tropical rain forest, with some of the greatest biodiversity of any region. In 2012, the number of trees cut down in the Amazon dropped to its lowest level in 20 years. The line graph (see attached) shows the number of square kilometers cleared from 2001 through 2012. The data in the line graph can be modeled by the following third- and fourth-degree polynomial functions (see attached): Then Solve; a. Use the Leading Coefficient Test to determine the end behavior to the right for the graph of f. b. Assume that the rate at which the Amazon rain forest is being cut down continues to decline. Based on your answer to part (a), will f be useful in modeling Amazon deforestation over an extended period of time? Explain your answer. c. Use the Leading Coefficient Test to determine the end behavior to the right for the graph of g. d. Assume that the rate at which the Amazon rain forest is being cut down continues to decline. Based on your…arrow_forwardGiven n+1 data pairs, a unique polynomial of degree passes through n +1 data points. Select one: a. n+1 O b. n or less С. n d. n+1 or lessarrow_forward
- Find y(4.5) if a second-degree polynomial is fitted to the following data: (1, 1.1), (1.5, 1.3), (2, 1.6), (2.5, 2), (3, 2.7), (3.5, 3.4), (4, 4.1). Round-off to four decimals.arrow_forwardActivity 1 Direction: Determine whether each expression is a polynomial or NOT. 1. x2 + 2x + 1 = 0 6. 2 x2- 1 = 0 11. 2x2 + 3x + 1 0 2. 5x³ + = 0 7.% x* y3-21x = 0 12. x2 + Vx - 8 = 0 3. 5x 2+5 = 0 8. 9 + vx - 3 = 0 13. 4x³ = 0 4. 10x* 2x + 1 = 0 "9. vy + 2 = 0 14.- -3 = 0 5. -x2 + 10 = 0 10.4 x3 + 2x = 0 15. X20 - 1 = 0arrow_forwardAccording to information released by the U.S. Census Bureau in July 2009, the population of Tuscaloosa, Alabama in the year 2000 was 77,906. If P(f) is the population of Tuscaloosa t years after 2000, interpret P(8) – P(7) = 2,063. A The product of the population in the year 2000 and 8 minus the product of the population in year 2000 and 7 is 2,063 citizens. 8 The change in the city's population from 2007 to 2008 is 2,063 citizens. C. The product of the population in the years 2000 and 2008 minus the product of the population in the years 2000 and 2007 equals 2,063 citizens. D. None of the abovearrow_forward
- The data in the table can be perfectly modeled by a polynomial with degree n. What is the value of n?arrow_forward3. Describe the end behavior of a 14th degree polynomial with a positive leading coefficient. 4. Describe the end behavior of a 9th degree polynomial with a negative leading coefficient.arrow_forwardUse finite differences to determine the degree of the polynomial that best describes the dataarrow_forward
