
Path To College Mathematics, Books A La Carte Edition Plus Mylab Math Student Access Kit
1st Edition
ISBN: 9780134618555
Author: Elayn Martin-Gay
Publisher: PEARSON
expand_more
expand_more
format_list_bulleted
Videos
Textbook Question
Chapter R.4, Problem 9ES
The following pictograph shows the average number of wildfires in the United States between 2009 and 2015. Use this graph to answer Exercises 9 through 16. See Example 1. (Source: National Interagency Fire Center)
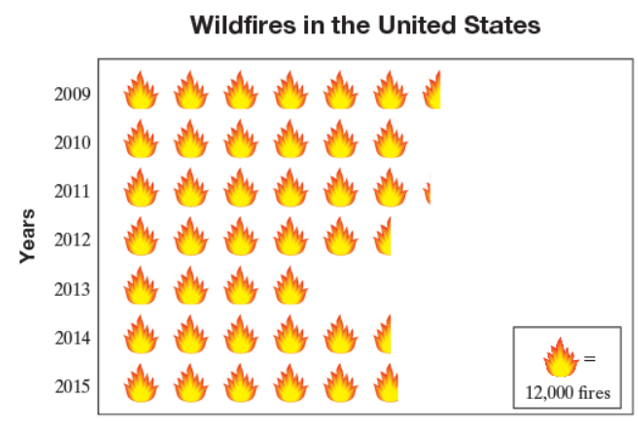
Approximate the number of wildfires in 2013.
Expert Solution & Answer
Want to see the full answer?
Check out a sample textbook solution
Students have asked these similar questions
https://mediaplayer.pearsoncmg.com/assets/APS10_sl_1202?clip=8
Video it links.
A researcher collected information about the height of different flowers. What type of data is height
What data are best displayed on a circle graph? On a bar graph?
Chapter R Solutions
Path To College Mathematics, Books A La Carte Edition Plus Mylab Math Student Access Kit
Ch. R.1 - Represent the shaded part of each geometric figure...Ch. R.1 - Represent the shaded part of each geometric figure...Ch. R.1 - Prob. 3ESCh. R.1 - Represent the shaded part of each geometric figure...Ch. R.1 - Prob. 5ESCh. R.1 - Write each number as product of primes. See...Ch. R.1 - Prob. 7ESCh. R.1 - Write each number as product of primes. See...Ch. R.1 - Write each number as product of primes. See...Ch. R.1 - Prob. 10ES
Ch. R.1 - Prob. 11ESCh. R.1 - Prob. 12ESCh. R.1 - Prob. 13ESCh. R.1 - Prob. 14ESCh. R.1 - Prob. 15ESCh. R.1 - Prob. 16ESCh. R.1 - Prob. 17ESCh. R.1 - Prob. 18ESCh. R.1 - Prob. 19ESCh. R.1 - Prob. 20ESCh. R.1 - Prob. 21ESCh. R.1 - Prob. 22ESCh. R.1 - Prob. 23ESCh. R.1 - Prob. 24ESCh. R.1 - Prob. 25ESCh. R.1 - Prob. 26ESCh. R.1 - Prob. 27ESCh. R.1 - Multiply or divided as indicated. Simplify the...Ch. R.1 - Multiply or divided as indicated. Simplify the...Ch. R.1 - Prob. 30ESCh. R.1 - Prob. 31ESCh. R.1 - Prob. 32ESCh. R.1 - Prob. 33ESCh. R.1 - Prob. 34ESCh. R.1 - Prob. 35ESCh. R.1 - Prob. 36ESCh. R.1 - Prob. 37ESCh. R.1 - Prob. 38ESCh. R.1 - Recall that the area of a plane figure is a...Ch. R.1 - Prob. 40ESCh. R.1 - Prob. 41ESCh. R.1 - Prob. 42ESCh. R.1 - Prob. 43ESCh. R.1 - Add or subtract as indicated. Write the answer in...Ch. R.1 - Prob. 45ESCh. R.1 - Prob. 46ESCh. R.1 - Prob. 47ESCh. R.1 - Prob. 48ESCh. R.1 - Prob. 49ESCh. R.1 - Prob. 50ESCh. R.1 - Prob. 51ESCh. R.1 - Prob. 52ESCh. R.1 - Prob. 53ESCh. R.1 - Prob. 54ESCh. R.1 - Prob. 55ESCh. R.1 - Prob. 56ESCh. R.1 - Prob. 57ESCh. R.1 - Prob. 58ESCh. R.1 - Prob. 59ESCh. R.1 - Prob. 60ESCh. R.1 - Prob. 61ESCh. R.1 - Prob. 62ESCh. R.1 - Prob. 63ESCh. R.1 - Prob. 64ESCh. R.1 - Prob. 65ESCh. R.1 - Prob. 66ESCh. R.1 - Prob. 67ESCh. R.1 - Prob. 68ESCh. R.1 - Prob. 69ESCh. R.1 - Prob. 70ESCh. R.1 - Prob. 71ESCh. R.1 - Prob. 72ESCh. R.1 - Prob. 73ESCh. R.1 - Prob. 74ESCh. R.1 - Prob. 75ESCh. R.1 - Prob. 76ESCh. R.1 - Prob. 77ESCh. R.1 - Mixed Practice Perform the following operations....Ch. R.1 - Prob. 79ESCh. R.1 - Prob. 80ESCh. R.1 - Mixed Practice Perform the following operations....Ch. R.1 - Prob. 82ESCh. R.1 - Prob. 83ESCh. R.1 - Prob. 84ESCh. R.1 - Prob. 85ESCh. R.1 - Mixed Practice Perform the following operations....Ch. R.1 - Prob. 87ESCh. R.1 - Prob. 88ESCh. R.1 - Mixed Practice 121433 Perform the following...Ch. R.1 - Prob. 90ESCh. R.1 - Prob. 91ESCh. R.1 - Prob. 92ESCh. R.1 - Prob. 93ESCh. R.1 - Prob. 94ESCh. R.1 - Prob. 95ESCh. R.1 - Prob. 96ESCh. R.1 - Prob. 97ESCh. R.1 - Prob. 98ESCh. R.1 - Prob. 99ESCh. R.1 - Prob. 100ESCh. R.1 - Prob. 101ESCh. R.1 - Prob. 102ESCh. R.1 - Prob. 103ESCh. R.1 - Prob. 104ESCh. R.1 - Prob. 105ESCh. R.1 - Prob. 106ESCh. R.1 - Prob. 107ESCh. R.1 - Prob. 108ESCh. R.1 - Prob. 109ESCh. R.1 - Prob. 110ESCh. R.2 - Write each decimal as a fraction. Do not simplify....Ch. R.2 - Prob. 2ESCh. R.2 - Prob. 3ESCh. R.2 - Prob. 4ESCh. R.2 - Prob. 5ESCh. R.2 - Prob. 6ESCh. R.2 - Prob. 7ESCh. R.2 - Prob. 8ESCh. R.2 - Prob. 9ESCh. R.2 - Prob. 10ESCh. R.2 - Prob. 11ESCh. R.2 - Prob. 12ESCh. R.2 - Prob. 13ESCh. R.2 - Prob. 14ESCh. R.2 - Prob. 15ESCh. R.2 - Prob. 16ESCh. R.2 - Prob. 17ESCh. R.2 - Prob. 18ESCh. R.2 - Prob. 19ESCh. R.2 - Prob. 20ESCh. R.2 - Prob. 21ESCh. R.2 - Prob. 22ESCh. R.2 - Multiply or divide as indicated. See Example 6 and...Ch. R.2 - Multiply or divide as indicated. See Example 6 and...Ch. R.2 - Mixed Practice Perform the indicated operation....Ch. R.2 - Mixed Practice Perform the indicated operation....Ch. R.2 - Mixed Practice Perform the indicated operation....Ch. R.2 - Mixed Practice Perform the indicated operation....Ch. R.2 - Mixed Practice Perform the indicated operation....Ch. R.2 - Mixed Practice Perform the indicated operation....Ch. R.2 - Mixed Practice 654.956.67 Perform the indicated...Ch. R.2 - Mixed Practice Perform the indicated operation....Ch. R.2 - Mixed Practice Perform the indicated operation....Ch. R.2 - Mixed Practice Perform the indicated operation....Ch. R.2 - Prob. 35ESCh. R.2 - Prob. 36ESCh. R.2 - Mixed Practice Perform the indicated operation....Ch. R.2 - Mixed Practice Perform the indicated operation....Ch. R.2 - Round each decimal to the given place value. See...Ch. R.2 - Round each decimal to the given place value. See...Ch. R.2 - Round each decimal to the given place value. See...Ch. R.2 - Round each decimal to the given place value. See...Ch. R.2 - Round each decimal to the given place value. See...Ch. R.2 - Round each decimal to the given place value. See...Ch. R.2 - Round each decimal to the given place value. See...Ch. R.2 - Round each decimal to the given place value. See...Ch. R.2 - Round each decimal to the given place value. See...Ch. R.2 - Round each decimal to the given place value. See...Ch. R.2 - Write each fraction as a decimal. If the decimal...Ch. R.2 - Write each fraction as a decimal. If the decimal...Ch. R.2 - Write each fraction as a decimal. If the decimal...Ch. R.2 - Write each fraction as a decimal. If the decimal...Ch. R.2 - Write each fraction as a decimal. If the decimal...Ch. R.2 - Write each fraction as a decimal. If the decimal...Ch. R.2 - Write each fraction as a decimal. If the decimal...Ch. R.2 - Write each fraction as a decimal. If the decimal...Ch. R.2 - Write each fraction as a decimal. If the decimal...Ch. R.2 - Write each fraction as a decimal. If the decimal...Ch. R.2 - Concept Extensions Solve. See the Concept Checks...Ch. R.2 - Concept Extensions Solve. See the Concept Checks...Ch. R.2 - Concept Extensions Solve. See the Concept Checks...Ch. R.2 - Concept Extensions Solve. See the Concept Checks...Ch. R.2 - The chart shows the average number of pounds of...Ch. R.2 - The chart shows the average number of pounds of...Ch. R.2 - The following graph is called a circle graph or...Ch. R.2 - The following graph is called a circle graph or...Ch. R.2 - The following graph is called a circle graph or...Ch. R.2 - The following graph is called a circle graph or...Ch. R.2 - The following graph is called a circle graph or...Ch. R.2 - The following graph is called a circle graph or...Ch. R.3 - Solve. See Example 1 and 2. In a survey of 100...Ch. R.3 - Solve. See Example 1 and 2. A basketball player...Ch. R.3 - One hundred adults were asked to name their...Ch. R.3 - One hundred adults were asked to name their...Ch. R.3 - One hundred adults were asked to name their...Ch. R.3 - One hundred adults were asked to name their...Ch. R.3 - Write each percent as a decimal. See Examples 3...Ch. R.3 - Write each percent as a decimal. See Examples 3...Ch. R.3 - Write each percent as a decimal. See Examples 3...Ch. R.3 - Write each percent as a decimal. See Examples 3...Ch. R.3 - Write each percent as a decimal. See Examples 3...Ch. R.3 - Write each percent as a decimal. See Examples 3...Ch. R.3 - Write each percent as a decimal. See Examples 3...Ch. R.3 - Write each percent as a decimal. See Examples 3...Ch. R.3 - Write each percent as a decimal. See Examples 3...Ch. R.3 - Write each percent as a decimal. See Examples 3...Ch. R.3 - Write each percent as a decimal. See Examples 3...Ch. R.3 - Write each percent as a decimal. See Examples 3...Ch. R.3 - Write each percent as a decimal. See Examples 3...Ch. R.3 - Write each percent as a decimal. See Examples 3...Ch. R.3 - Write each percent as a decimal. See Examples 3...Ch. R.3 - Write each percent as a decimal. See Examples 3...Ch. R.3 - Write each percent as a fraction or mixed number...Ch. R.3 - Write each percent as a fraction or mixed number...Ch. R.3 - Write each percent as a fraction or mixed number...Ch. R.3 - Write each percent as a fraction or mixed number...Ch. R.3 - Write each percent as a fraction or mixed number...Ch. R.3 - Write each percent as a fraction or mixed number...Ch. R.3 - Write each percent as a fraction or mixed number...Ch. R.3 - Write each percent as a fraction or mixed number...Ch. R.3 - Write each percent as a fraction or mixed number...Ch. R.3 - Write each percent as a fraction or mixed number...Ch. R.3 - Write each percent as a fraction or mixed number...Ch. R.3 - Write each percent as a fraction or mixed number...Ch. R.3 - Write each percent as a fraction or mixed number...Ch. R.3 - Write each percent as a fraction or mixed number...Ch. R.3 - Write each decimal as a percent. See Examples 13...Ch. R.3 - Write each decimal as a percent. See Examples 13...Ch. R.3 - Write each decimal as a percent. See Examples 13...Ch. R.3 - Write each decimal as a percent. See Examples 13...Ch. R.3 - Write each decimal as a percent. See Examples 13...Ch. R.3 - Write each decimal as a percent. See Examples 13...Ch. R.3 - Write each decimal as a percent. See Examples 13...Ch. R.3 - Write each decimal as a percent. See Examples 13...Ch. R.3 - Write each decimal as a percent. See Examples 13...Ch. R.3 - Write each decimal as a percent. See Examples 13...Ch. R.3 - Prob. 47ESCh. R.3 - Write each decimal as a percent. See Examples 13...Ch. R.3 - Write each decimal as a percent. See Examples 13...Ch. R.3 - Write each decimal as a percent. See Examples 13...Ch. R.3 - Write each fraction or mixed number as a percent....Ch. R.3 - Write each fraction or mixed number as a percent....Ch. R.3 - Write each fraction or mixed number as a percent....Ch. R.3 - Write each fraction or mixed number as a percent....Ch. R.3 - Write each fraction or mixed number as a percent....Ch. R.3 - Write each fraction or mixed number as a percent....Ch. R.3 - Write each fraction or mixed number as a percent....Ch. R.3 - Write each fraction or mixed number as a percent....Ch. R.3 - Write each fraction or mixed number as a percent....Ch. R.3 - Write each fraction or mixed number as a percent....Ch. R.3 - Write each fraction or mixed number as a percent....Ch. R.3 - Write each fraction or mixed number as a percent....Ch. R.3 - Write each fraction or mixed number as a percent....Ch. R.3 - Write each fraction or mixed number as a percent....Ch. R.3 - Write each fraction as a percent. Round to the...Ch. R.3 - Write each fraction as a percent. Round to the...Ch. R.3 - Write each fraction as a percent. Round to the...Ch. R.3 - Write each fraction as a percent. Round to the...Ch. R.3 - Mixed Practice Complete each table. See Example 1...Ch. R.3 - Mixed Practice Complete each table. See Example 1...Ch. R.3 - Mixed Practice Complete each table. See Example 1...Ch. R.3 - Mixed Practice Complete each table. See Example 1...Ch. R.3 - Write each percent as a decimal and a fraction....Ch. R.3 - Write each percent as a decimal and a fraction....Ch. R.3 - Write each percent as a decimal and a fraction....Ch. R.3 - Write each percent as a decimal and a fraction....Ch. R.3 - Write each percent as a decimal and a fraction....Ch. R.3 - Write each percent as a decimal and a fraction....Ch. R.3 - In Exercises 79 through 82, write the percent from...Ch. R.3 - In Exercises 79 through 82, write the percent from...Ch. R.3 - In Exercises 79 through 82, write the percent from...Ch. R.3 - In Exercises 79 through 82, write the percent from...Ch. R.3 - Solve. See Examples 21 and 22. In a particular...Ch. R.3 - Solve. See Examples 21 and 22. The United States'...Ch. R.3 - Solve. See Examples 21 and 22. The mirrors on the...Ch. R.3 - Solve. See Examples 21 and 22. In a particular...Ch. R.3 - Solve. See Examples 21 and 22. The U.S. Postal...Ch. R.3 - Solve. See Examples 21 and 22. In the United...Ch. R.3 - Concept Extensions Solve. See the Concept Checks...Ch. R.3 - Concept Extensions 0.5269, Solve. See the Concept...Ch. R.3 - Concept Extensions Solve. See the Concept Checks...Ch. R.3 - Concept Extensions Solve. See the Concept Checks...Ch. R.3 - Recall that 1=100 This means that 1 whole is 100....Ch. R.3 - Recall that 1=100 This means that 1 whole is 100....Ch. R.3 - What percent of the figure is shaded?Ch. R.3 - What percent of the figure is shaded?Ch. R.3 - Fill in the blanks. A fraction written as a...Ch. R.3 - Fill in the blanks. A decimal written as a percent...Ch. R.3 - Write each fraction as a decimal and then Mite...Ch. R.3 - Write each fraction as a decimal and then Mite...Ch. R.3 - The bar graph shows the predicted fastest-growing...Ch. R.3 - The bar graph shows the predicted fastest-growing...Ch. R.3 - The bar graph shows the predicted fastest-growing...Ch. R.3 - The bar graph shows the predicted fastest-growing...Ch. R.3 - The bar graph shows the predicted fastest-growing...Ch. R.3 - The bar graph shows the predicted fastest-growing...Ch. R.4 - The following pictograph shows the number of acres...Ch. R.4 - The following pictograph shows the number of acres...Ch. R.4 - The following pictograph shows the number of acres...Ch. R.4 - The following pictograph shows the number of acres...Ch. R.4 - Prob. 5ESCh. R.4 - The following pictograph shows the number of acres...Ch. R.4 - The following pictograph shows the number of acres...Ch. R.4 - The following pictograph shows the number of acres...Ch. R.4 - The following pictograph shows the average number...Ch. R.4 - The following pictograph shows the average number...Ch. R.4 - The following pictograph shows the average number...Ch. R.4 - The following pictograph shows the average number...Ch. R.4 - The following pictograph shows the average number...Ch. R.4 - The following pictograph shows the average number...Ch. R.4 - The following pictograph shows the average number...Ch. R.4 - The following pictograph shows the average number...Ch. R.4 - The National Weather Service has exacting...Ch. R.4 - The National Weather Service has exacting...Ch. R.4 - The National Weather Service has exacting...Ch. R.4 - The National Weather Service has exacting...Ch. R.4 - The National Weather Service has exacting...Ch. R.4 - The National Weather Service has exacting...Ch. R.4 - The following horizontal bar graph shows a recent...Ch. R.4 - The following horizontal bar graph shows a recent...Ch. R.4 - The following horizontal bar graph shows a recent...Ch. R.4 - The following horizontal bar graph shows a recent...Ch. R.4 - The following horizontal bar graph shows a recent...Ch. R.4 - The following horizontal bar graph shows a recent...Ch. R.4 - Use the information given to draw a vertical bar...Ch. R.4 - Use the information given to draw a vertical bar...Ch. R.4 - Prob. 31ESCh. R.4 - Prob. 32ESCh. R.4 - The histogram to the right shows the number of...Ch. R.4 - The histogram to the right shows the number of...Ch. R.4 - Prob. 35ESCh. R.4 - The histogram to the right shows the number of...Ch. R.4 - Prob. 37ESCh. R.4 - The histogram to the right shows the number of...Ch. R.4 - The histogram to the right shows the number of...Ch. R.4 - The histogram to the right shows the number of...Ch. R.4 - The histogram to the right shows the number of...Ch. R.4 - The histogram to the right shows the number of...Ch. R.4 - Prob. 43ESCh. R.4 - The following histogram shows the ages of...Ch. R.4 - The following histogram shows the ages of...Ch. R.4 - The following histogram shows the ages of...Ch. R.4 - The following histogram shows the ages of...Ch. R.4 - The following histogram shows the ages of...Ch. R.4 - Prob. 49ESCh. R.4 - The following histogram shows the ages of...Ch. R.4 - The following list shows the golf scores for an...Ch. R.4 - The following list shows the golf scores for an...Ch. R.4 - Prob. 53ESCh. R.4 - Prob. 54ESCh. R.4 - Twenty-five people in a survey were asked to give...Ch. R.4 - Prob. 56ESCh. R.4 - Prob. 57ESCh. R.4 - Prob. 58ESCh. R.4 - Prob. 59ESCh. R.4 - Prob. 60ESCh. R.4 - Use the frequency distribution table from...Ch. R.4 - Use the frequency distribution table from...Ch. R.4 - Prob. 63ESCh. R.4 - Beach Soccer World Cup is now held every two...Ch. R.4 - Prob. 65ESCh. R.4 - Beach Soccer World Cup is now held every two...Ch. R.4 - Beach Soccer World Cup is now held every two...Ch. R.4 - Prob. 68ESCh. R.4 - Prob. 69ESCh. R.4 - Beach Soccer World Cup is now held every two...Ch. R.4 - The following circle graph is a result of...Ch. R.4 - The following circle graph is a result of...Ch. R.4 - Prob. 73ESCh. R.4 - The following circle graph is a result of...Ch. R.4 - Prob. 75ESCh. R.4 - The following circle graph is a result of...Ch. R.4 - The following circle graph shows the percent of...Ch. R.4 - The following circle graph shows the percent of...Ch. R.4 - Prob. 79ESCh. R.4 - The following circle graph shows the percent of...Ch. R.4 - Prob. 81ESCh. R.4 - The total amount of land from the continents is...Ch. R.4 - Prob. 83ESCh. R.4 - The total amount of land from the continents is...Ch. R.4 - Prob. 85ESCh. R.4 - The following circle graph shows the percent of...Ch. R.4 - The following circle graph shows the percent of...Ch. R.4 - The following circle graph shows the percent of...Ch. R.4 - Prob. 89ESCh. R.4 - If this has 125,600 books, find how many books are...Ch. R.4 - Prob. 91ESCh. R.4 - If this has 125,600 books, find how many books are...Ch. R.4 - Prob. 93ESCh. R.4 - If this has 125,600 books, find how many books are...Ch. R.4 - Concept Extensions The following double line graph...Ch. R.4 - Prob. 96ESCh. R.4 - Prob. 97ESCh. R.4 - Concept Extensions The following double line graph...Ch. R.4 - Concept Extensions The following double line graph...Ch. R.4 - Concept Extensions The following double line graph...Ch. R.4 - Concept Extensions The following double line graph...Ch. R.4 - Concept Extensions The following double line graph...Ch. R.4 - Prob. 103ESCh. R.4 - The following circle graph shows the relative...Ch. R.4 - Prob. 105ESCh. R.4 - These oceans together make up 264,489,800 square...Ch. R.4 - Prob. 107ESCh. R.4 - These oceans together make up 264,489,800 square...Ch. R.4 - The following circle graph summarizes the results...Ch. R.4 - The following circle graph summarizes the results...Ch. R.4 - The following circle graph summarizes the results...Ch. R.4 - The following circle graph summarizes the results...Ch. R.4 - The following circle graph summarizes the results...Ch. R.4 - The following circle graph summarizes the results...Ch. R.4 - See the Concept Checks in this section. Can the...Ch. R.4 - True or false? The smaller a sector in a circle...Ch. R - Chapter R Vocabulary Check Fill in each blank with...Ch. R - Prob. 2VCCh. R - Chapter R Vocabulary Check Fill in each blank with...Ch. R - Prob. 4VCCh. R - Prob. 5VCCh. R - Prob. 6VCCh. R - Prob. 7VCCh. R - Prob. 8VCCh. R - Prob. 9VCCh. R - Prob. 10VCCh. R - Chapter R Vocabulary Check Fill in each blank with...Ch. R - Chapter R Vocabulary Check Fill in each blank with...Ch. R - Prob. 13VCCh. R - Prob. 14VCCh. R - Prob. 15VCCh. R - Prob. 16VCCh. R - Prob. 1RCh. R - (R.1) Write the number as product of prime...Ch. R - Prob. 3RCh. R - Perform the indicated operations. Write results in...Ch. R - Prob. 5RCh. R - Perform the indicated operations. Write results in...Ch. R - Perform the indicated operations. Write results in...Ch. R - Perform the indicated operations. Write results in...Ch. R - Perform the indicated operations. Write results in...Ch. R - Perform the indicated operations. Write results in...Ch. R - Each circle represents a whole, or 1. Determine...Ch. R - Each circle represents a whole, or 1. Determine...Ch. R - Find the area and the perimeter of each figure.Ch. R - Find the area and the perimeter of each figure.Ch. R - What was the total weigh of the boy octuplets?Ch. R - What was the total weight of the girl octuplets?Ch. R - Prob. 17RCh. R - Which baby weighed the most?Ch. R - Prob. 19RCh. R - How much more did the heaviest baby weigh than the...Ch. R - Prob. 21RCh. R - Write each decimal as a fraction. Do not simplify....Ch. R - Prob. 23RCh. R - Prob. 24RCh. R - Perform each indicated operation. 184.62Ch. R - Prob. 26RCh. R - Prob. 27RCh. R - Prob. 28RCh. R - Prob. 29RCh. R - Perform each indicated operation. 0.0613.8Ch. R - Prob. 31RCh. R - Round each decimal to given place value. 25.6293,...Ch. R - Prob. 33RCh. R - Prob. 34RCh. R - Write each fraction as a decimal. If the decimal...Ch. R - Write each fraction as a decimal. If the decimal...Ch. R - (R.3) Solve. In a survey of 100 adults, 37...Ch. R - Prob. 38RCh. R - Write each percent as a decimal. 26Ch. R - Write each percent as a decimal. 75Ch. R - Prob. 41RCh. R - Write each percent as a decimal. 1.5Ch. R - Prob. 43RCh. R - Write each percent as a decimal. 400Ch. R - Prob. 45RCh. R - Write each percent as a decimal. 85.34Ch. R - Prob. 47RCh. R - Write each decimal as a percent. 0.055Ch. R - Prob. 49RCh. R - Prob. 50RCh. R - Prob. 51RCh. R - Prob. 52RCh. R - Prob. 53RCh. R - Prob. 54RCh. R - Prob. 55RCh. R - Prob. 56RCh. R - Prob. 57RCh. R - Write each percent as a fraction or mixed number...Ch. R - Prob. 59RCh. R - Write each percent as a fraction or mixed number...Ch. R - Prob. 61RCh. R - Prob. 62RCh. R - Prob. 63RCh. R - Write each fraction or mixed number as percent....Ch. R - Prob. 65RCh. R - Write each fraction or mixed number as percent....Ch. R - Prob. 67RCh. R - Prob. 68RCh. R - Write each fraction or mixed number as percent....Ch. R - Write each fraction or mixed number as percent. 58Ch. R - (R.4) The following pictograph shows the number of...Ch. R - (R.4) The following pictograph shows the number of...Ch. R - Prob. 73RCh. R - Prob. 74RCh. R - Prob. 75RCh. R - Prob. 76RCh. R - The following bar graph shows the percent of...Ch. R - The following bar graph shows the percent of...Ch. R - The following bar graph shows the percent of...Ch. R - The following bar graph shows the percent of...Ch. R - Prob. 81RCh. R - The following line graph shows the total number of...Ch. R - Prob. 83RCh. R - The following line graph shows the total number of...Ch. R - The following line graph shows the total number of...Ch. R - The following line graph shows the total number of...Ch. R - Prob. 87RCh. R - Prob. 88RCh. R - Prob. 89RCh. R - The following histogram shows the hours worked per...Ch. R - Prob. 91RCh. R - Following is a list of monthly record high...Ch. R - Following is a list of monthly record high...Ch. R - Use the table from Exercises 91-93 to draw a...Ch. R - Prob. 95RCh. R - The following circle graph shows a familys $4000...Ch. R - Prob. 97RCh. R - The following circle graph shows a familys $4000...Ch. R - The following circle graph shows a familys $4000...Ch. R - The following circle graph shows a familys $4000...Ch. R - Prob. 101RCh. R - In a recent year, there were approximately 62...Ch. R - Prob. 103RCh. R - In a recent year, there were approximately 62...Ch. R - Prob. 1TCh. R - Prob. 2TCh. R - Prob. 3TCh. R - Prob. 4TCh. R - Perform each indicated operation and simplify....Ch. R - Prob. 6TCh. R - Prob. 7TCh. R - Prob. 8TCh. R - Prob. 9TCh. R - Prob. 10TCh. R - Prob. 11TCh. R - Prob. 12TCh. R - Prob. 13TCh. R - Prob. 14TCh. R - Prob. 15TCh. R - Prob. 16TCh. R - Prob. 17TCh. R - Prob. 18TCh. R - Prob. 19TCh. R - Prob. 20TCh. R - Prob. 21TCh. R - Prob. 22TCh. R - Prob. 23TCh. R - Prob. 24TCh. R - Prob. 25TCh. R - Prob. 26TCh. R - Prob. 27TCh. R - Prob. 28TCh. R - Prob. 29TCh. R - Prob. 30TCh. R - Prob. 31TCh. R - Prob. 32TCh. R - Prob. 33TCh. R - Prob. 34TCh. R - Prob. 35TCh. R - Prob. 36TCh. R - Prob. 37TCh. R - Prob. 38TCh. R - Prob. 39TCh. R - Prob. 40T
Knowledge Booster


Learn more about
Need a deep-dive on the concept behind this application? Look no further. Learn more about this topic, subject and related others by exploring similar questions and additional content below.Similar questions
- Please help write the answer on computerarrow_forwardMany times, it is not easy or feasible to find the frequency of data from a very large dataset. So, to make sense of the data, you make your own frequency table and graphs. Using the heights of ten students in centimeters. 139, 145, 150, 145, 136, 150, 152, 144, 138, 138. Represent each data in three graphs of Presentation; A. Line Graph B. Bar Graph C. Pie Chartarrow_forwardPlease answer it completely and correctly.arrow_forward
- Create a graph to report the top 10 causes of death in the United States for 2010. 10 Leading Causes of Death by Age Group, United States – 2010arrow_forwardScientists studied pocket mice living on dark volcanic rock in both new mexico and fifty miles away in arizona. They recorded their data in the chart below. State one possible hypothesis that would explain the differences in the observed data between the two locations. USE THE NUMBERS IN THE GRAPH!!arrow_forwardThese are the first-semester test scores of four nursing students taking the same class. Vaughn: 35, 64, 87, 91, 77 Harriet: 76, 82, 78, 78, 78 Robyn: 64,95,80,95, 70 Antonio75,55,88,85, 86 Which student has the greatest range in their test scores? GeoGebra Graphing Calculator a.Robyn b.Antonio c.Harriet dVaughnarrow_forward
- Sorry i forgot to add the pic here me need helparrow_forwardPLEASE, DRAW THE FOLLOWING GRAPHS ON PAPER. DO NOT POST CODES FROM INTERNET WEBSITES. I DO NOT KNOW HOW TO USE THEM. THANKSarrow_forwardEach of three friends flips a coin 36 times. Angel records “tails” 20 times. Michael records “tails” 17 times. Fernanda records “tails” 23 times. Find the relative frequency with which each friend records “tails”.. Single line text.arrow_forward
- What type of relationship is indicated in the scatterplot7arrow_forwardin a pie chart, if a category has a relative frequency of 30%, then its sector takes up 30% of the circle. true or false?arrow_forwardWhen a person in California renews the registration for an automobile, the bar graph shown below is included with the bill. Use this bar graph to answer the question. The following statement is included with the graph. There is no safe way to drive after drinking. These charts show that a few drinks can make you an unsafe driver. They show that drinking affects your BLOOD ALCOHOL CONCENTRATION (BAC). The BAC zones for various numbers of drinks and time periods are printed in white, gray, and red. HOW TO USE THESE CHARTS: First, find the chart that includes your weight. For example, if you weigh 160 lbs., use the "150 to 169" chart. Then look under "Total Drinks" at the "2" on this "150 to 169" chart. Now look below the "2" drinks, in the row for 1 hour. You'll see your BAC is in the gray shaded zone. This means that if you drive after 2 drinks in 1 hour, you could be arrested. In the gray zone, your chances of having an accident are 5 times higher than if you had no drinks. But if you…arrow_forward
arrow_back_ios
SEE MORE QUESTIONS
arrow_forward_ios
Recommended textbooks for you
 Glencoe Algebra 1, Student Edition, 9780079039897...AlgebraISBN:9780079039897Author:CarterPublisher:McGraw Hill
 Algebra: Structure And Method, Book 1AlgebraISBN:9780395977224Author:Richard G. Brown, Mary P. Dolciani, Robert H. Sorgenfrey, William L. ColePublisher:McDougal Littell
 Holt Mcdougal Larson Pre-algebra: Student Edition...AlgebraISBN:9780547587776Author:HOLT MCDOUGALPublisher:HOLT MCDOUGAL
Glencoe Algebra 1, Student Edition, 9780079039897...
Algebra
ISBN:9780079039897
Author:Carter
Publisher:McGraw Hill
Algebra: Structure And Method, Book 1
Algebra
ISBN:9780395977224
Author:Richard G. Brown, Mary P. Dolciani, Robert H. Sorgenfrey, William L. Cole
Publisher:McDougal Littell
Holt Mcdougal Larson Pre-algebra: Student Edition...
Algebra
ISBN:9780547587776
Author:HOLT MCDOUGAL
Publisher:HOLT MCDOUGAL
Basic Reflection Trigonometric Identity; Author: Anil kumar;https://www.youtube.com/watch?v=y-EGUD49fmw;License: Standard YouTube License, CC-BY