
Path To College Mathematics, Books A La Carte Edition Plus Mylab Math Student Access Kit
1st Edition
ISBN: 9780134618555
Author: Elayn Martin-Gay
Publisher: PEARSON
expand_more
expand_more
format_list_bulleted
Videos
Textbook Question
Chapter R.4, Problem 80ES
The following circle graph shows the percent of the land area of the continents of Earth. use this graph for Exercises through 80. See Example 10.
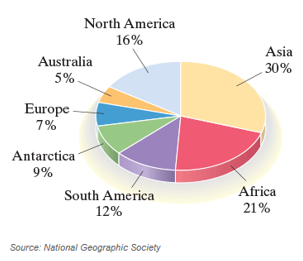
What percent of the land on Earth is accounted for by North and South America?
Expert Solution & Answer
Want to see the full answer?
Check out a sample textbook solution
Students have asked these similar questions
badly needed right now, please
Business Math*
Explain why the following quantities show direct relationships.
1. Distance and time when a person is walking.
2. Distance traveled of a car and the amount of gas in tank.
3. Diameter and circumstances of a circle.
4. Total amount of sales and the number of gadgets sold.
Explain why the following quantities show inverse relationships.
1. Time and speed.
2. Number of worker and days.
3. Volume and pressure.
A farmer plants crops on 48 acres of land. The circle graph shows the percentages of land
used for some of the different types of crops.
Land for Crops
Corn
Cotton
40%
Other
10%
Wheat
20%
Based on the circle graph, how many acres of land are used for corn?
Record your answer and fill in the bubbles on your answer document. Be sure to use the
correct place value.
Chapter R Solutions
Path To College Mathematics, Books A La Carte Edition Plus Mylab Math Student Access Kit
Ch. R.1 - Represent the shaded part of each geometric figure...Ch. R.1 - Represent the shaded part of each geometric figure...Ch. R.1 - Prob. 3ESCh. R.1 - Represent the shaded part of each geometric figure...Ch. R.1 - Prob. 5ESCh. R.1 - Write each number as product of primes. See...Ch. R.1 - Prob. 7ESCh. R.1 - Write each number as product of primes. See...Ch. R.1 - Write each number as product of primes. See...Ch. R.1 - Prob. 10ES
Ch. R.1 - Prob. 11ESCh. R.1 - Prob. 12ESCh. R.1 - Prob. 13ESCh. R.1 - Prob. 14ESCh. R.1 - Prob. 15ESCh. R.1 - Prob. 16ESCh. R.1 - Prob. 17ESCh. R.1 - Prob. 18ESCh. R.1 - Prob. 19ESCh. R.1 - Prob. 20ESCh. R.1 - Prob. 21ESCh. R.1 - Prob. 22ESCh. R.1 - Prob. 23ESCh. R.1 - Prob. 24ESCh. R.1 - Prob. 25ESCh. R.1 - Prob. 26ESCh. R.1 - Prob. 27ESCh. R.1 - Multiply or divided as indicated. Simplify the...Ch. R.1 - Multiply or divided as indicated. Simplify the...Ch. R.1 - Prob. 30ESCh. R.1 - Prob. 31ESCh. R.1 - Prob. 32ESCh. R.1 - Prob. 33ESCh. R.1 - Prob. 34ESCh. R.1 - Prob. 35ESCh. R.1 - Prob. 36ESCh. R.1 - Prob. 37ESCh. R.1 - Prob. 38ESCh. R.1 - Recall that the area of a plane figure is a...Ch. R.1 - Prob. 40ESCh. R.1 - Prob. 41ESCh. R.1 - Prob. 42ESCh. R.1 - Prob. 43ESCh. R.1 - Add or subtract as indicated. Write the answer in...Ch. R.1 - Prob. 45ESCh. R.1 - Prob. 46ESCh. R.1 - Prob. 47ESCh. R.1 - Prob. 48ESCh. R.1 - Prob. 49ESCh. R.1 - Prob. 50ESCh. R.1 - Prob. 51ESCh. R.1 - Prob. 52ESCh. R.1 - Prob. 53ESCh. R.1 - Prob. 54ESCh. R.1 - Prob. 55ESCh. R.1 - Prob. 56ESCh. R.1 - Prob. 57ESCh. R.1 - Prob. 58ESCh. R.1 - Prob. 59ESCh. R.1 - Prob. 60ESCh. R.1 - Prob. 61ESCh. R.1 - Prob. 62ESCh. R.1 - Prob. 63ESCh. R.1 - Prob. 64ESCh. R.1 - Prob. 65ESCh. R.1 - Prob. 66ESCh. R.1 - Prob. 67ESCh. R.1 - Prob. 68ESCh. R.1 - Prob. 69ESCh. R.1 - Prob. 70ESCh. R.1 - Prob. 71ESCh. R.1 - Prob. 72ESCh. R.1 - Prob. 73ESCh. R.1 - Prob. 74ESCh. R.1 - Prob. 75ESCh. R.1 - Prob. 76ESCh. R.1 - Prob. 77ESCh. R.1 - Mixed Practice Perform the following operations....Ch. R.1 - Prob. 79ESCh. R.1 - Prob. 80ESCh. R.1 - Mixed Practice Perform the following operations....Ch. R.1 - Prob. 82ESCh. R.1 - Prob. 83ESCh. R.1 - Prob. 84ESCh. R.1 - Prob. 85ESCh. R.1 - Mixed Practice Perform the following operations....Ch. R.1 - Prob. 87ESCh. R.1 - Prob. 88ESCh. R.1 - Mixed Practice 121433 Perform the following...Ch. R.1 - Prob. 90ESCh. R.1 - Prob. 91ESCh. R.1 - Prob. 92ESCh. R.1 - Prob. 93ESCh. R.1 - Prob. 94ESCh. R.1 - Prob. 95ESCh. R.1 - Prob. 96ESCh. R.1 - Prob. 97ESCh. R.1 - Prob. 98ESCh. R.1 - Prob. 99ESCh. R.1 - Prob. 100ESCh. R.1 - Prob. 101ESCh. R.1 - Prob. 102ESCh. R.1 - Prob. 103ESCh. R.1 - Prob. 104ESCh. R.1 - Prob. 105ESCh. R.1 - Prob. 106ESCh. R.1 - Prob. 107ESCh. R.1 - Prob. 108ESCh. R.1 - Prob. 109ESCh. R.1 - Prob. 110ESCh. R.2 - Write each decimal as a fraction. Do not simplify....Ch. R.2 - Prob. 2ESCh. R.2 - Prob. 3ESCh. R.2 - Prob. 4ESCh. R.2 - Prob. 5ESCh. R.2 - Prob. 6ESCh. R.2 - Prob. 7ESCh. R.2 - Prob. 8ESCh. R.2 - Prob. 9ESCh. R.2 - Prob. 10ESCh. R.2 - Prob. 11ESCh. R.2 - Prob. 12ESCh. R.2 - Prob. 13ESCh. R.2 - Prob. 14ESCh. R.2 - Prob. 15ESCh. R.2 - Prob. 16ESCh. R.2 - Prob. 17ESCh. R.2 - Prob. 18ESCh. R.2 - Prob. 19ESCh. R.2 - Prob. 20ESCh. R.2 - Prob. 21ESCh. R.2 - Prob. 22ESCh. R.2 - Multiply or divide as indicated. See Example 6 and...Ch. R.2 - Multiply or divide as indicated. See Example 6 and...Ch. R.2 - Mixed Practice Perform the indicated operation....Ch. R.2 - Mixed Practice Perform the indicated operation....Ch. R.2 - Mixed Practice Perform the indicated operation....Ch. R.2 - Mixed Practice Perform the indicated operation....Ch. R.2 - Mixed Practice Perform the indicated operation....Ch. R.2 - Mixed Practice Perform the indicated operation....Ch. R.2 - Mixed Practice 654.956.67 Perform the indicated...Ch. R.2 - Mixed Practice Perform the indicated operation....Ch. R.2 - Mixed Practice Perform the indicated operation....Ch. R.2 - Mixed Practice Perform the indicated operation....Ch. R.2 - Prob. 35ESCh. R.2 - Prob. 36ESCh. R.2 - Mixed Practice Perform the indicated operation....Ch. R.2 - Mixed Practice Perform the indicated operation....Ch. R.2 - Round each decimal to the given place value. See...Ch. R.2 - Round each decimal to the given place value. See...Ch. R.2 - Round each decimal to the given place value. See...Ch. R.2 - Round each decimal to the given place value. See...Ch. R.2 - Round each decimal to the given place value. See...Ch. R.2 - Round each decimal to the given place value. See...Ch. R.2 - Round each decimal to the given place value. See...Ch. R.2 - Round each decimal to the given place value. See...Ch. R.2 - Round each decimal to the given place value. See...Ch. R.2 - Round each decimal to the given place value. See...Ch. R.2 - Write each fraction as a decimal. If the decimal...Ch. R.2 - Write each fraction as a decimal. If the decimal...Ch. R.2 - Write each fraction as a decimal. If the decimal...Ch. R.2 - Write each fraction as a decimal. If the decimal...Ch. R.2 - Write each fraction as a decimal. If the decimal...Ch. R.2 - Write each fraction as a decimal. If the decimal...Ch. R.2 - Write each fraction as a decimal. If the decimal...Ch. R.2 - Write each fraction as a decimal. If the decimal...Ch. R.2 - Write each fraction as a decimal. If the decimal...Ch. R.2 - Write each fraction as a decimal. If the decimal...Ch. R.2 - Concept Extensions Solve. See the Concept Checks...Ch. R.2 - Concept Extensions Solve. See the Concept Checks...Ch. R.2 - Concept Extensions Solve. See the Concept Checks...Ch. R.2 - Concept Extensions Solve. See the Concept Checks...Ch. R.2 - The chart shows the average number of pounds of...Ch. R.2 - The chart shows the average number of pounds of...Ch. R.2 - The following graph is called a circle graph or...Ch. R.2 - The following graph is called a circle graph or...Ch. R.2 - The following graph is called a circle graph or...Ch. R.2 - The following graph is called a circle graph or...Ch. R.2 - The following graph is called a circle graph or...Ch. R.2 - The following graph is called a circle graph or...Ch. R.3 - Solve. See Example 1 and 2. In a survey of 100...Ch. R.3 - Solve. See Example 1 and 2. A basketball player...Ch. R.3 - One hundred adults were asked to name their...Ch. R.3 - One hundred adults were asked to name their...Ch. R.3 - One hundred adults were asked to name their...Ch. R.3 - One hundred adults were asked to name their...Ch. R.3 - Write each percent as a decimal. See Examples 3...Ch. R.3 - Write each percent as a decimal. See Examples 3...Ch. R.3 - Write each percent as a decimal. See Examples 3...Ch. R.3 - Write each percent as a decimal. See Examples 3...Ch. R.3 - Write each percent as a decimal. See Examples 3...Ch. R.3 - Write each percent as a decimal. See Examples 3...Ch. R.3 - Write each percent as a decimal. See Examples 3...Ch. R.3 - Write each percent as a decimal. See Examples 3...Ch. R.3 - Write each percent as a decimal. See Examples 3...Ch. R.3 - Write each percent as a decimal. See Examples 3...Ch. R.3 - Write each percent as a decimal. See Examples 3...Ch. R.3 - Write each percent as a decimal. See Examples 3...Ch. R.3 - Write each percent as a decimal. See Examples 3...Ch. R.3 - Write each percent as a decimal. See Examples 3...Ch. R.3 - Write each percent as a decimal. See Examples 3...Ch. R.3 - Write each percent as a decimal. See Examples 3...Ch. R.3 - Write each percent as a fraction or mixed number...Ch. R.3 - Write each percent as a fraction or mixed number...Ch. R.3 - Write each percent as a fraction or mixed number...Ch. R.3 - Write each percent as a fraction or mixed number...Ch. R.3 - Write each percent as a fraction or mixed number...Ch. R.3 - Write each percent as a fraction or mixed number...Ch. R.3 - Write each percent as a fraction or mixed number...Ch. R.3 - Write each percent as a fraction or mixed number...Ch. R.3 - Write each percent as a fraction or mixed number...Ch. R.3 - Write each percent as a fraction or mixed number...Ch. R.3 - Write each percent as a fraction or mixed number...Ch. R.3 - Write each percent as a fraction or mixed number...Ch. R.3 - Write each percent as a fraction or mixed number...Ch. R.3 - Write each percent as a fraction or mixed number...Ch. R.3 - Write each decimal as a percent. See Examples 13...Ch. R.3 - Write each decimal as a percent. See Examples 13...Ch. R.3 - Write each decimal as a percent. See Examples 13...Ch. R.3 - Write each decimal as a percent. See Examples 13...Ch. R.3 - Write each decimal as a percent. See Examples 13...Ch. R.3 - Write each decimal as a percent. See Examples 13...Ch. R.3 - Write each decimal as a percent. See Examples 13...Ch. R.3 - Write each decimal as a percent. See Examples 13...Ch. R.3 - Write each decimal as a percent. See Examples 13...Ch. R.3 - Write each decimal as a percent. See Examples 13...Ch. R.3 - Prob. 47ESCh. R.3 - Write each decimal as a percent. See Examples 13...Ch. R.3 - Write each decimal as a percent. See Examples 13...Ch. R.3 - Write each decimal as a percent. See Examples 13...Ch. R.3 - Write each fraction or mixed number as a percent....Ch. R.3 - Write each fraction or mixed number as a percent....Ch. R.3 - Write each fraction or mixed number as a percent....Ch. R.3 - Write each fraction or mixed number as a percent....Ch. R.3 - Write each fraction or mixed number as a percent....Ch. R.3 - Write each fraction or mixed number as a percent....Ch. R.3 - Write each fraction or mixed number as a percent....Ch. R.3 - Write each fraction or mixed number as a percent....Ch. R.3 - Write each fraction or mixed number as a percent....Ch. R.3 - Write each fraction or mixed number as a percent....Ch. R.3 - Write each fraction or mixed number as a percent....Ch. R.3 - Write each fraction or mixed number as a percent....Ch. R.3 - Write each fraction or mixed number as a percent....Ch. R.3 - Write each fraction or mixed number as a percent....Ch. R.3 - Write each fraction as a percent. Round to the...Ch. R.3 - Write each fraction as a percent. Round to the...Ch. R.3 - Write each fraction as a percent. Round to the...Ch. R.3 - Write each fraction as a percent. Round to the...Ch. R.3 - Mixed Practice Complete each table. See Example 1...Ch. R.3 - Mixed Practice Complete each table. See Example 1...Ch. R.3 - Mixed Practice Complete each table. See Example 1...Ch. R.3 - Mixed Practice Complete each table. See Example 1...Ch. R.3 - Write each percent as a decimal and a fraction....Ch. R.3 - Write each percent as a decimal and a fraction....Ch. R.3 - Write each percent as a decimal and a fraction....Ch. R.3 - Write each percent as a decimal and a fraction....Ch. R.3 - Write each percent as a decimal and a fraction....Ch. R.3 - Write each percent as a decimal and a fraction....Ch. R.3 - In Exercises 79 through 82, write the percent from...Ch. R.3 - In Exercises 79 through 82, write the percent from...Ch. R.3 - In Exercises 79 through 82, write the percent from...Ch. R.3 - In Exercises 79 through 82, write the percent from...Ch. R.3 - Solve. See Examples 21 and 22. In a particular...Ch. R.3 - Solve. See Examples 21 and 22. The United States'...Ch. R.3 - Solve. See Examples 21 and 22. The mirrors on the...Ch. R.3 - Solve. See Examples 21 and 22. In a particular...Ch. R.3 - Solve. See Examples 21 and 22. The U.S. Postal...Ch. R.3 - Solve. See Examples 21 and 22. In the United...Ch. R.3 - Concept Extensions Solve. See the Concept Checks...Ch. R.3 - Concept Extensions 0.5269, Solve. See the Concept...Ch. R.3 - Concept Extensions Solve. See the Concept Checks...Ch. R.3 - Concept Extensions Solve. See the Concept Checks...Ch. R.3 - Recall that 1=100 This means that 1 whole is 100....Ch. R.3 - Recall that 1=100 This means that 1 whole is 100....Ch. R.3 - What percent of the figure is shaded?Ch. R.3 - What percent of the figure is shaded?Ch. R.3 - Fill in the blanks. A fraction written as a...Ch. R.3 - Fill in the blanks. A decimal written as a percent...Ch. R.3 - Write each fraction as a decimal and then Mite...Ch. R.3 - Write each fraction as a decimal and then Mite...Ch. R.3 - The bar graph shows the predicted fastest-growing...Ch. R.3 - The bar graph shows the predicted fastest-growing...Ch. R.3 - The bar graph shows the predicted fastest-growing...Ch. R.3 - The bar graph shows the predicted fastest-growing...Ch. R.3 - The bar graph shows the predicted fastest-growing...Ch. R.3 - The bar graph shows the predicted fastest-growing...Ch. R.4 - The following pictograph shows the number of acres...Ch. R.4 - The following pictograph shows the number of acres...Ch. R.4 - The following pictograph shows the number of acres...Ch. R.4 - The following pictograph shows the number of acres...Ch. R.4 - Prob. 5ESCh. R.4 - The following pictograph shows the number of acres...Ch. R.4 - The following pictograph shows the number of acres...Ch. R.4 - The following pictograph shows the number of acres...Ch. R.4 - The following pictograph shows the average number...Ch. R.4 - The following pictograph shows the average number...Ch. R.4 - The following pictograph shows the average number...Ch. R.4 - The following pictograph shows the average number...Ch. R.4 - The following pictograph shows the average number...Ch. R.4 - The following pictograph shows the average number...Ch. R.4 - The following pictograph shows the average number...Ch. R.4 - The following pictograph shows the average number...Ch. R.4 - The National Weather Service has exacting...Ch. R.4 - The National Weather Service has exacting...Ch. R.4 - The National Weather Service has exacting...Ch. R.4 - The National Weather Service has exacting...Ch. R.4 - The National Weather Service has exacting...Ch. R.4 - The National Weather Service has exacting...Ch. R.4 - The following horizontal bar graph shows a recent...Ch. R.4 - The following horizontal bar graph shows a recent...Ch. R.4 - The following horizontal bar graph shows a recent...Ch. R.4 - The following horizontal bar graph shows a recent...Ch. R.4 - The following horizontal bar graph shows a recent...Ch. R.4 - The following horizontal bar graph shows a recent...Ch. R.4 - Use the information given to draw a vertical bar...Ch. R.4 - Use the information given to draw a vertical bar...Ch. R.4 - Prob. 31ESCh. R.4 - Prob. 32ESCh. R.4 - The histogram to the right shows the number of...Ch. R.4 - The histogram to the right shows the number of...Ch. R.4 - Prob. 35ESCh. R.4 - The histogram to the right shows the number of...Ch. R.4 - Prob. 37ESCh. R.4 - The histogram to the right shows the number of...Ch. R.4 - The histogram to the right shows the number of...Ch. R.4 - The histogram to the right shows the number of...Ch. R.4 - The histogram to the right shows the number of...Ch. R.4 - The histogram to the right shows the number of...Ch. R.4 - Prob. 43ESCh. R.4 - The following histogram shows the ages of...Ch. R.4 - The following histogram shows the ages of...Ch. R.4 - The following histogram shows the ages of...Ch. R.4 - The following histogram shows the ages of...Ch. R.4 - The following histogram shows the ages of...Ch. R.4 - Prob. 49ESCh. R.4 - The following histogram shows the ages of...Ch. R.4 - The following list shows the golf scores for an...Ch. R.4 - The following list shows the golf scores for an...Ch. R.4 - Prob. 53ESCh. R.4 - Prob. 54ESCh. R.4 - Twenty-five people in a survey were asked to give...Ch. R.4 - Prob. 56ESCh. R.4 - Prob. 57ESCh. R.4 - Prob. 58ESCh. R.4 - Prob. 59ESCh. R.4 - Prob. 60ESCh. R.4 - Use the frequency distribution table from...Ch. R.4 - Use the frequency distribution table from...Ch. R.4 - Prob. 63ESCh. R.4 - Beach Soccer World Cup is now held every two...Ch. R.4 - Prob. 65ESCh. R.4 - Beach Soccer World Cup is now held every two...Ch. R.4 - Beach Soccer World Cup is now held every two...Ch. R.4 - Prob. 68ESCh. R.4 - Prob. 69ESCh. R.4 - Beach Soccer World Cup is now held every two...Ch. R.4 - The following circle graph is a result of...Ch. R.4 - The following circle graph is a result of...Ch. R.4 - Prob. 73ESCh. R.4 - The following circle graph is a result of...Ch. R.4 - Prob. 75ESCh. R.4 - The following circle graph is a result of...Ch. R.4 - The following circle graph shows the percent of...Ch. R.4 - The following circle graph shows the percent of...Ch. R.4 - Prob. 79ESCh. R.4 - The following circle graph shows the percent of...Ch. R.4 - Prob. 81ESCh. R.4 - The total amount of land from the continents is...Ch. R.4 - Prob. 83ESCh. R.4 - The total amount of land from the continents is...Ch. R.4 - Prob. 85ESCh. R.4 - The following circle graph shows the percent of...Ch. R.4 - The following circle graph shows the percent of...Ch. R.4 - The following circle graph shows the percent of...Ch. R.4 - Prob. 89ESCh. R.4 - If this has 125,600 books, find how many books are...Ch. R.4 - Prob. 91ESCh. R.4 - If this has 125,600 books, find how many books are...Ch. R.4 - Prob. 93ESCh. R.4 - If this has 125,600 books, find how many books are...Ch. R.4 - Concept Extensions The following double line graph...Ch. R.4 - Prob. 96ESCh. R.4 - Prob. 97ESCh. R.4 - Concept Extensions The following double line graph...Ch. R.4 - Concept Extensions The following double line graph...Ch. R.4 - Concept Extensions The following double line graph...Ch. R.4 - Concept Extensions The following double line graph...Ch. R.4 - Concept Extensions The following double line graph...Ch. R.4 - Prob. 103ESCh. R.4 - The following circle graph shows the relative...Ch. R.4 - Prob. 105ESCh. R.4 - These oceans together make up 264,489,800 square...Ch. R.4 - Prob. 107ESCh. R.4 - These oceans together make up 264,489,800 square...Ch. R.4 - The following circle graph summarizes the results...Ch. R.4 - The following circle graph summarizes the results...Ch. R.4 - The following circle graph summarizes the results...Ch. R.4 - The following circle graph summarizes the results...Ch. R.4 - The following circle graph summarizes the results...Ch. R.4 - The following circle graph summarizes the results...Ch. R.4 - See the Concept Checks in this section. Can the...Ch. R.4 - True or false? The smaller a sector in a circle...Ch. R - Chapter R Vocabulary Check Fill in each blank with...Ch. R - Prob. 2VCCh. R - Chapter R Vocabulary Check Fill in each blank with...Ch. R - Prob. 4VCCh. R - Prob. 5VCCh. R - Prob. 6VCCh. R - Prob. 7VCCh. R - Prob. 8VCCh. R - Prob. 9VCCh. R - Prob. 10VCCh. R - Chapter R Vocabulary Check Fill in each blank with...Ch. R - Chapter R Vocabulary Check Fill in each blank with...Ch. R - Prob. 13VCCh. R - Prob. 14VCCh. R - Prob. 15VCCh. R - Prob. 16VCCh. R - Prob. 1RCh. R - (R.1) Write the number as product of prime...Ch. R - Prob. 3RCh. R - Perform the indicated operations. Write results in...Ch. R - Prob. 5RCh. R - Perform the indicated operations. Write results in...Ch. R - Perform the indicated operations. Write results in...Ch. R - Perform the indicated operations. Write results in...Ch. R - Perform the indicated operations. Write results in...Ch. R - Perform the indicated operations. Write results in...Ch. R - Each circle represents a whole, or 1. Determine...Ch. R - Each circle represents a whole, or 1. Determine...Ch. R - Find the area and the perimeter of each figure.Ch. R - Find the area and the perimeter of each figure.Ch. R - What was the total weigh of the boy octuplets?Ch. R - What was the total weight of the girl octuplets?Ch. R - Prob. 17RCh. R - Which baby weighed the most?Ch. R - Prob. 19RCh. R - How much more did the heaviest baby weigh than the...Ch. R - Prob. 21RCh. R - Write each decimal as a fraction. Do not simplify....Ch. R - Prob. 23RCh. R - Prob. 24RCh. R - Perform each indicated operation. 184.62Ch. R - Prob. 26RCh. R - Prob. 27RCh. R - Prob. 28RCh. R - Prob. 29RCh. R - Perform each indicated operation. 0.0613.8Ch. R - Prob. 31RCh. R - Round each decimal to given place value. 25.6293,...Ch. R - Prob. 33RCh. R - Prob. 34RCh. R - Write each fraction as a decimal. If the decimal...Ch. R - Write each fraction as a decimal. If the decimal...Ch. R - (R.3) Solve. In a survey of 100 adults, 37...Ch. R - Prob. 38RCh. R - Write each percent as a decimal. 26Ch. R - Write each percent as a decimal. 75Ch. R - Prob. 41RCh. R - Write each percent as a decimal. 1.5Ch. R - Prob. 43RCh. R - Write each percent as a decimal. 400Ch. R - Prob. 45RCh. R - Write each percent as a decimal. 85.34Ch. R - Prob. 47RCh. R - Write each decimal as a percent. 0.055Ch. R - Prob. 49RCh. R - Prob. 50RCh. R - Prob. 51RCh. R - Prob. 52RCh. R - Prob. 53RCh. R - Prob. 54RCh. R - Prob. 55RCh. R - Prob. 56RCh. R - Prob. 57RCh. R - Write each percent as a fraction or mixed number...Ch. R - Prob. 59RCh. R - Write each percent as a fraction or mixed number...Ch. R - Prob. 61RCh. R - Prob. 62RCh. R - Prob. 63RCh. R - Write each fraction or mixed number as percent....Ch. R - Prob. 65RCh. R - Write each fraction or mixed number as percent....Ch. R - Prob. 67RCh. R - Prob. 68RCh. R - Write each fraction or mixed number as percent....Ch. R - Write each fraction or mixed number as percent. 58Ch. R - (R.4) The following pictograph shows the number of...Ch. R - (R.4) The following pictograph shows the number of...Ch. R - Prob. 73RCh. R - Prob. 74RCh. R - Prob. 75RCh. R - Prob. 76RCh. R - The following bar graph shows the percent of...Ch. R - The following bar graph shows the percent of...Ch. R - The following bar graph shows the percent of...Ch. R - The following bar graph shows the percent of...Ch. R - Prob. 81RCh. R - The following line graph shows the total number of...Ch. R - Prob. 83RCh. R - The following line graph shows the total number of...Ch. R - The following line graph shows the total number of...Ch. R - The following line graph shows the total number of...Ch. R - Prob. 87RCh. R - Prob. 88RCh. R - Prob. 89RCh. R - The following histogram shows the hours worked per...Ch. R - Prob. 91RCh. R - Following is a list of monthly record high...Ch. R - Following is a list of monthly record high...Ch. R - Use the table from Exercises 91-93 to draw a...Ch. R - Prob. 95RCh. R - The following circle graph shows a familys $4000...Ch. R - Prob. 97RCh. R - The following circle graph shows a familys $4000...Ch. R - The following circle graph shows a familys $4000...Ch. R - The following circle graph shows a familys $4000...Ch. R - Prob. 101RCh. R - In a recent year, there were approximately 62...Ch. R - Prob. 103RCh. R - In a recent year, there were approximately 62...Ch. R - Prob. 1TCh. R - Prob. 2TCh. R - Prob. 3TCh. R - Prob. 4TCh. R - Perform each indicated operation and simplify....Ch. R - Prob. 6TCh. R - Prob. 7TCh. R - Prob. 8TCh. R - Prob. 9TCh. R - Prob. 10TCh. R - Prob. 11TCh. R - Prob. 12TCh. R - Prob. 13TCh. R - Prob. 14TCh. R - Prob. 15TCh. R - Prob. 16TCh. R - Prob. 17TCh. R - Prob. 18TCh. R - Prob. 19TCh. R - Prob. 20TCh. R - Prob. 21TCh. R - Prob. 22TCh. R - Prob. 23TCh. R - Prob. 24TCh. R - Prob. 25TCh. R - Prob. 26TCh. R - Prob. 27TCh. R - Prob. 28TCh. R - Prob. 29TCh. R - Prob. 30TCh. R - Prob. 31TCh. R - Prob. 32TCh. R - Prob. 33TCh. R - Prob. 34TCh. R - Prob. 35TCh. R - Prob. 36TCh. R - Prob. 37TCh. R - Prob. 38TCh. R - Prob. 39TCh. R - Prob. 40T
Knowledge Booster


Learn more about
Need a deep-dive on the concept behind this application? Look no further. Learn more about this topic, subject and related others by exploring similar questions and additional content below.Similar questions
- Demographers are scientists who study trends in populations, including how the percent of people in different age groups changes over time. The table gives some information about the U.S. population in 2010. Answer questions 1dash–4 below. LOADING... Click the icon to view the population table. 1. Complete the table. Express the number of people in millions. U.S. Population (2010) Age Group Number of People (millions) Percent of Population Total 308.7 100% 0dash–17 nothing 24.0% 65 and older 40.3 nothing% (Type integers or decimals rounded to the nearest tenth as needed.)arrow_forwardI am not able to see the percent tablearrow_forwardSee uploaded picture for question.arrow_forward
- So I'll include a line graph for a second visual aid. I have a chart to show the proportion of students by major that have student loan debt at our school.arrow_forwardDiscribe a specific time in real life where a population being surveyed is appropriate. What data are you trying to collect, and give reasons why surveying the population is appropriate. 1. Describe the situation 2. Support why surveying the population is appropriate, using details.arrow_forwardPlease answer percentage changes.arrow_forward
- Record the type of screened electronic devices (ipad, iphone, TV, laptop, etc) you have in your home AND their screen sizes. Screen size is measure across the diagonal. What is the variable and scale of a variable?arrow_forwardhelp with D, E, Farrow_forwardMs. Duda’s class is hanging 500 red lanterns around the school for Lunar New Year. Before lunch, the class hangs 100 of the lanterns. PART A Draw a model to show what percent of 500 lanterns the class hangs before lunch.arrow_forward
- The data in the picture contains purchase data for golf purchases. Create a doughnut chart in Excel to compare the purchases by gender each year with the US population. Below the chart, explain what it illustrates.arrow_forwardPls help ASAParrow_forwardAndre earns $5200 a month at his new job. In order to track his spending and saving, he created a monthly budget Andre divided his income into five categories and created the following circle graph to represent the budget he created for himself. Use this circle graph to answer the following questions. How much more money does Andre budget for Groceries and Utilities than he does for savings?? SHOW WORK PLEASE.arrow_forward
arrow_back_ios
SEE MORE QUESTIONS
arrow_forward_ios
Recommended textbooks for you
 Holt Mcdougal Larson Pre-algebra: Student Edition...AlgebraISBN:9780547587776Author:HOLT MCDOUGALPublisher:HOLT MCDOUGAL
 Algebra: Structure And Method, Book 1AlgebraISBN:9780395977224Author:Richard G. Brown, Mary P. Dolciani, Robert H. Sorgenfrey, William L. ColePublisher:McDougal Littell
Holt Mcdougal Larson Pre-algebra: Student Edition...
Algebra
ISBN:9780547587776
Author:HOLT MCDOUGAL
Publisher:HOLT MCDOUGAL
Algebra: Structure And Method, Book 1
Algebra
ISBN:9780395977224
Author:Richard G. Brown, Mary P. Dolciani, Robert H. Sorgenfrey, William L. Cole
Publisher:McDougal Littell
What Are Research Ethics?; Author: HighSchoolScience101;https://www.youtube.com/watch?v=nX4c3V23DZI;License: Standard YouTube License, CC-BY
What is Ethics in Research - ethics in research (research ethics); Author: Chee-Onn Leong;https://www.youtube.com/watch?v=W8Vk0sXtMGU;License: Standard YouTube License, CC-BY