
Concept explainers
Videos
Without using a calculator, make a rough sketch of the graph.
- (a) y = x3
- (b) y = (x + 1)3
- (c) y = (x − 2)3 + 3
- (d) y = 4 − x2
- (e)
- (f)
- (g) y = −2x
- (h) y = 1 + x−1
a)
To sketch: The graph of the function
Explanation of Solution
Compute a table for various values of x and then use the value of the function to sketch a smooth curve of
| x | 0 | ||||
| y | 0 | 1 | 8 |
The graph for the given function
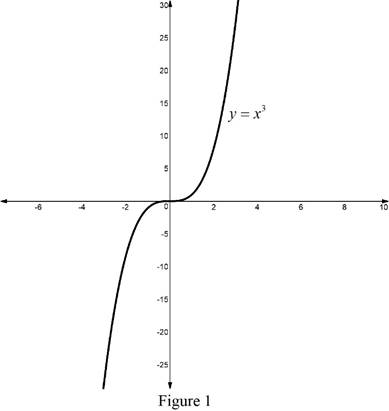
From Figure 1 it is observed that, the graph of the function
b)
To sketch: The graph of the function
Explanation of Solution
Compute a table for various values of x and then use the value of the function to sketch a smooth curve of
| x | 0 | ||||
| y | 0 | 1 | 8 | 27 |
The graph for the given function
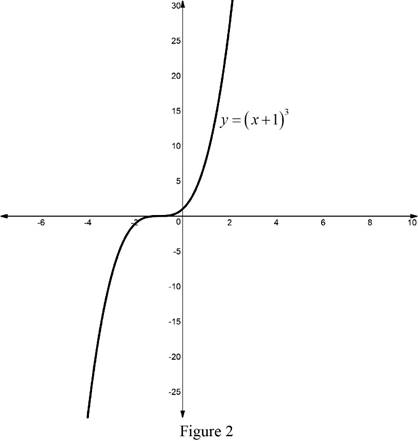
From Figure 2 it is observed that, the graph of the function
c)
To sketch: The graph of the function
Explanation of Solution
Compute a table for various values of x and then use the value of the function to sketch a smooth curve of
| x | 0 | ||||
| y | 0 |
The graph for the given function
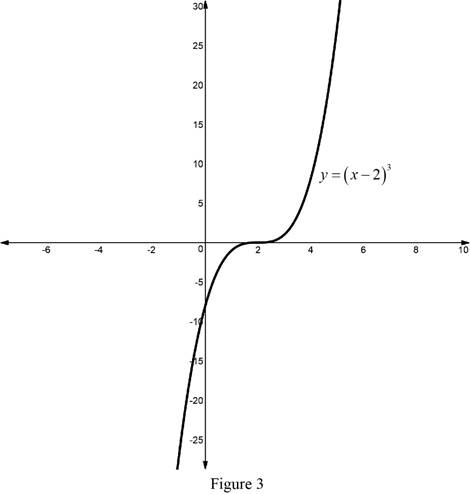
According to the transaltion and reflection of the function the graph of the function
The graph for the given function
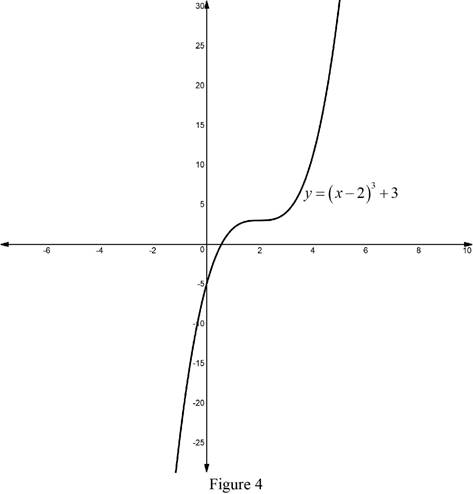
From Figure 2 , it is observed that the graph of the function
d)
To sketch: The graph of the function
Explanation of Solution
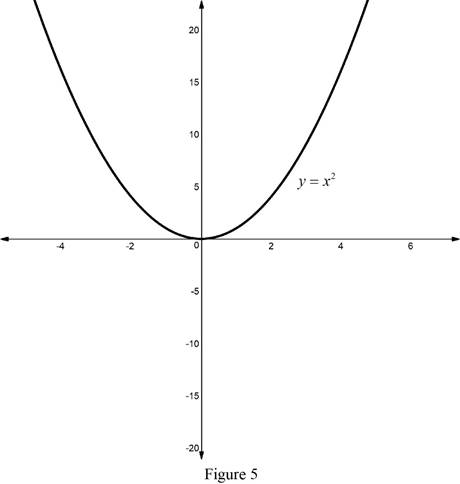
Compute a table for various values of x and then use the value of the function to sketch a smooth curve of
| x | 0 | ||||
| y | 4 | 1 | 0 | 1 | 4 |
The graph for the given function
According to the transaltion and reflection of the function the graph of the function
The graph for the given function
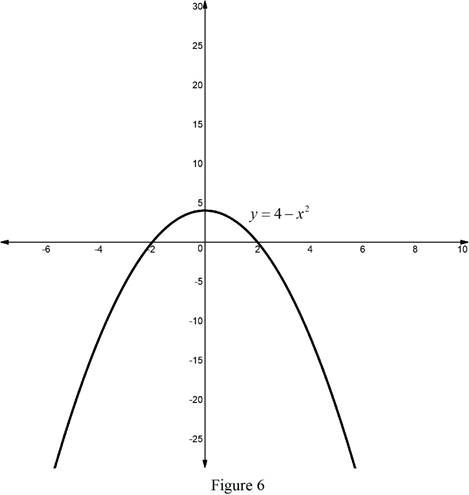
From Figure 6 it is observed that, the graph of the function
e)
To sketch: The graph of the function
Explanation of Solution
Compute a table for various values of x and then use the value of the function to sketch a smooth curve of
| x | 1 | 2 | 3 | 4 | 5 |
| y | 1 | 2 |
The graph for the given function
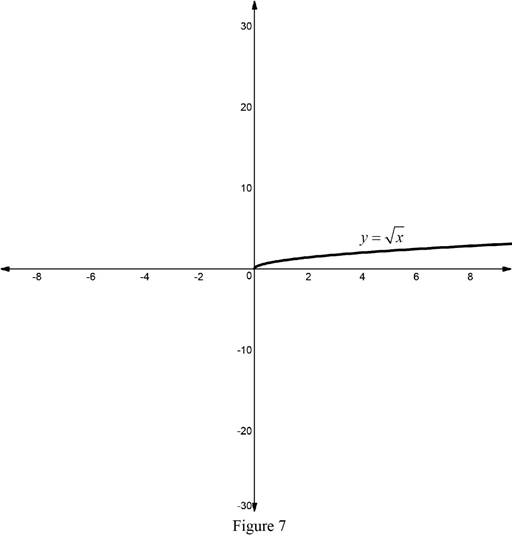
From Figure 7 it is observed that, the graph of the function
f)
To sketch: The graph of the function
Explanation of Solution
Compute a table for various values of x and then use the value of the function to sketch a smooth curve of
| x | 1 | 2 | 3 | 4 | 5 |
| y | 2 | 4 |
The graph for the given function
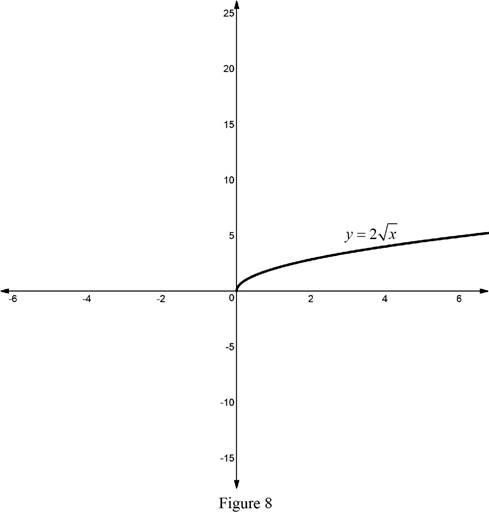
From Figure 8 it is observed that, the graph of the function
g)
To sketch: The graph of the function
Explanation of Solution
Compute a table for various values of x and then use the value of the function to sketch a smooth curve of
| x | 0 | 1 | 2 | 3 | |
| y | 1 | 2 | 4 | 8 |
The graph for the given function
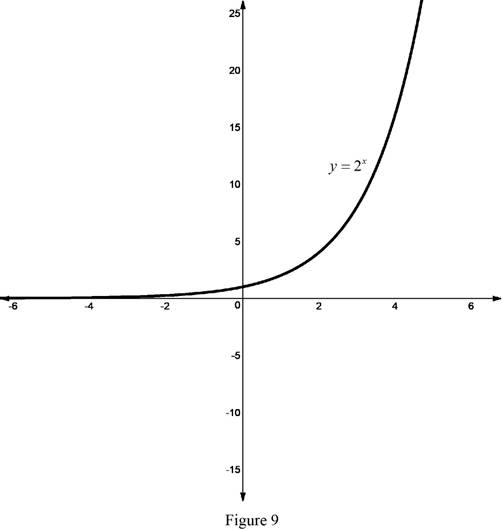
Reflect the graph of
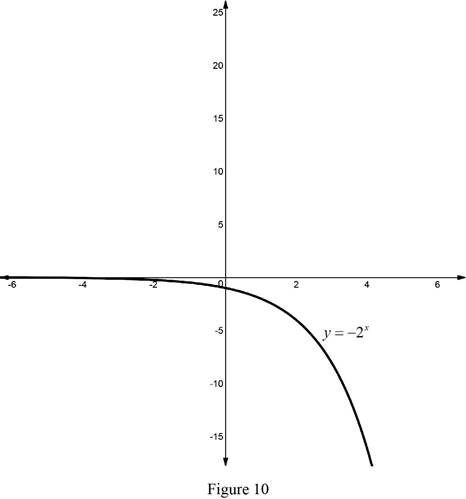
From Figure 10 it is observed that, the graph of the function
g)
To sketch: The graph of the function
Explanation of Solution
Compute a table for various values of x and then use the value of the function to sketch a smooth curve of
| x | 1 | ||||
| y | 1 | 2 |
The graph for the given function
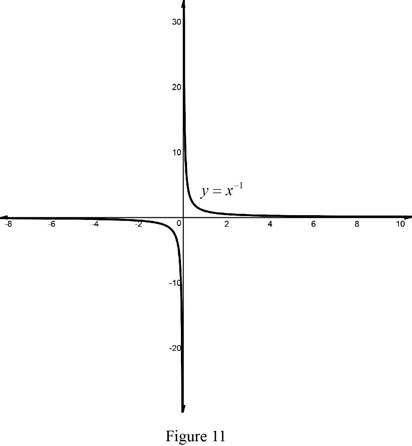
According to the translation of the function the graph of the function
The graph for the given function
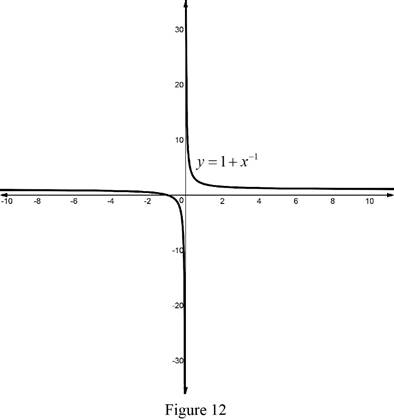
From Figure 12 it is observed that, the graph of the function
Chapter T Solutions
Single Variable Calculus: Concepts and Contexts, Enhanced Edition
Additional Math Textbook Solutions
Calculus: Early Transcendentals (2nd Edition)
Precalculus: A Unit Circle Approach
Calculus & Its Applications (14th Edition)
Precalculus (6th Edition)
Single Variable Calculus: Early Transcendentals (2nd Edition) - Standalone book
Precalculus: Mathematics for Calculus - 6th Edition


 Calculus: Early TranscendentalsCalculusISBN:9781285741550Author:James StewartPublisher:Cengage Learning
 Thomas' Calculus (14th Edition)CalculusISBN:9780134438986Author:Joel R. Hass, Christopher E. Heil, Maurice D. WeirPublisher:PEARSON
 Calculus: Early Transcendentals (3rd Edition)CalculusISBN:9780134763644Author:William L. Briggs, Lyle Cochran, Bernard Gillett, Eric SchulzPublisher:PEARSON
 Calculus: Early TranscendentalsCalculusISBN:9781319050740Author:Jon Rogawski, Colin Adams, Robert FranzosaPublisher:W. H. Freeman
 Calculus: Early Transcendental FunctionsCalculusISBN:9781337552516Author:Ron Larson, Bruce H. EdwardsPublisher:Cengage Learning