.. 10 e QUANTITY (Thoands of jaet Suppose there are 1o fiems in this industry, each of which has the cost curves previeusly shown. On the following praph, use the orange points (rovare symbol) to plot points along the portion of the industry's short-run supoly curve that coresponds to prices where there is postve outout. (Note: You are given more points to plot than you need.) Then, plece the black point (plus symbol) on the grash to indicate the short-run eouilorum price and auentity in this market Note: Dashed drop lines will automatically extend to both aves. 100 Industry's Shon-Run Supply Demand 70 Equilbrium 20 10 firms will neither enter nor exit 100 150 200 20 300 400 40 s00 QUANTITY (Thousands of jackets) some firms will enter some firms will exit (ppelad pa 3d ura 1e
.. 10 e QUANTITY (Thoands of jaet Suppose there are 1o fiems in this industry, each of which has the cost curves previeusly shown. On the following praph, use the orange points (rovare symbol) to plot points along the portion of the industry's short-run supoly curve that coresponds to prices where there is postve outout. (Note: You are given more points to plot than you need.) Then, plece the black point (plus symbol) on the grash to indicate the short-run eouilorum price and auentity in this market Note: Dashed drop lines will automatically extend to both aves. 100 Industry's Shon-Run Supply Demand 70 Equilbrium 20 10 firms will neither enter nor exit 100 150 200 20 300 400 40 s00 QUANTITY (Thousands of jackets) some firms will enter some firms will exit (ppelad pa 3d ura 1e

Chapter1: Making Economics Decisions
Section: Chapter Questions
Problem 1QTC

Related questions
Question
Please help solve and explain this equation
Transcribed Image Text:P Search (Alt+Q)
Zoch, Abigail F
AutoSave
ff
Document1
Word
ZA
File
Home
Design
References
Mailings
Review
View
Help
Picture Format
A Share
P Comments
Insert
Draw
Layout
5n
Firm's Short-Run Supply
80
70
00
40
30
20
10
10 18 20 2 0 35 40
50
45
QUANTITY (Thousands of jackets)
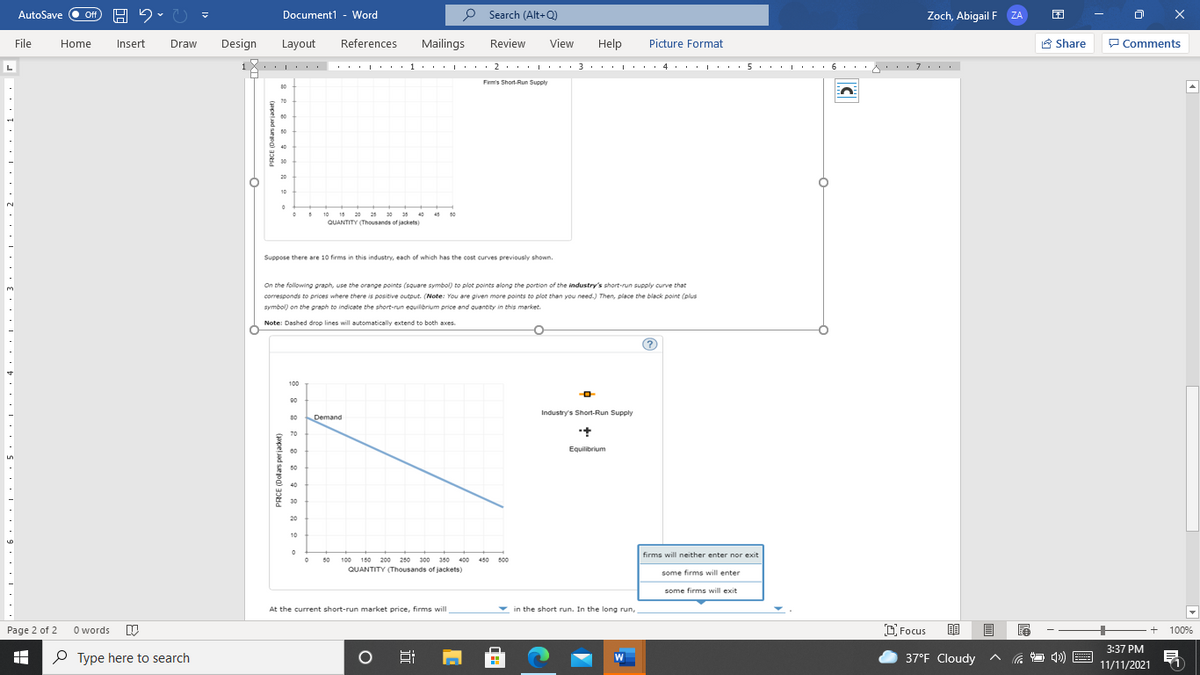
Suppose there are 10 firms in this industry, each of which has the cost curves previously shown.
On the following graph, use the orange points (square symbol) to plot points along the portion of the industry's short-run supply curve that
3.
corresponds to prices where there is positive output. (Note: You are given more points to plot than you need.) Then, place the black point (plus
symbol) on the graph to indicate the short-run equilibrium price and quantity in this market.
Note: Dashed drop lines will automatically extend to both axes.
100
Industry's Short-Run Supply
Demand
70
00
Equilibrium
50
40
* 30
20
10
firms will neither enter nor exit
50
100 150 200 280 300 360 400
450 600
QUANTITY (Thousands of jackets)
some firms will enter
some firms will exit
At the current short-run market price, firms will
in the short run. In the long run,
Page 2 of 2
O words
O Focus
100%
3:37 PM
P Type here to search
37°F Cloudy
1)
11/11/2021
(ppeljad seog) 3o
Transcribed Image Text:AutoSave
Document1
Word
O Search (Alt+Q)
ff
Zoch, Abigail F
ZA
File
Home
Insert
Draw
Design
Layout
References
Mailings
Review
View
Help
Picture Format
A Share
P Comments
iX.. . . . . . L:. .1·.. L:. . 2. . . L: .· 3· . . L . . . 4. . · L·..5 . . . L: . . 6. . 7.
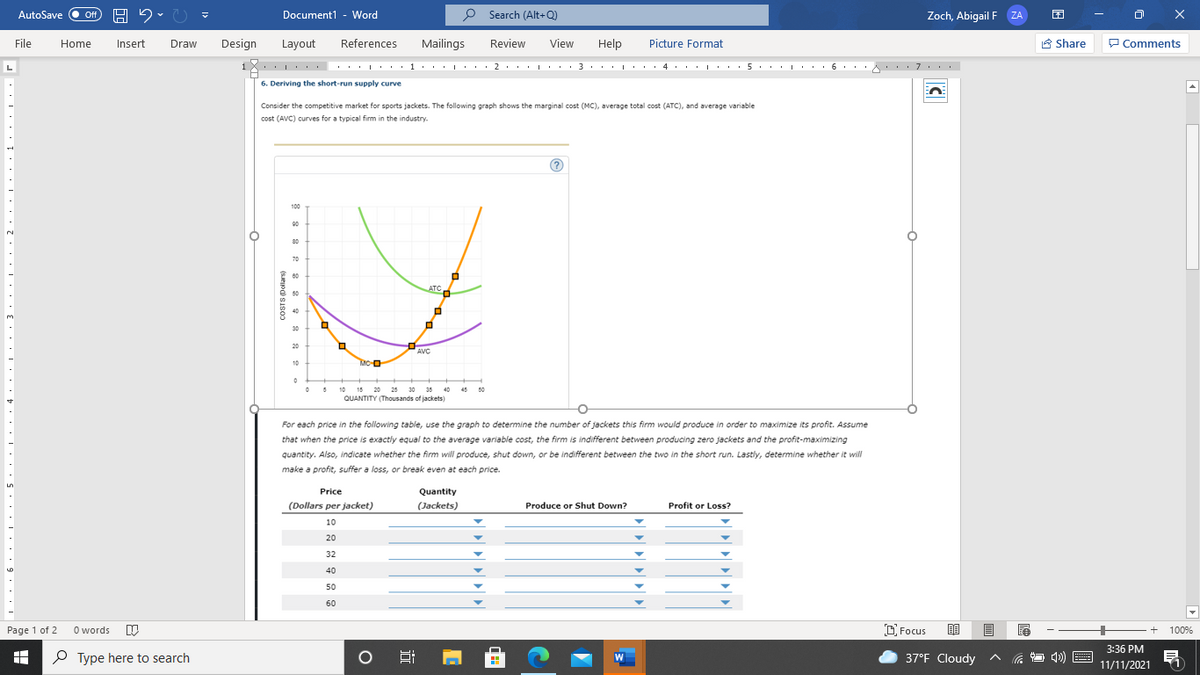
6. Deriving the short-run supply curve
Consider the competitive market for sports jackets. The following graph shows the marginal cost (MC), average total cost (ATC), and average variable
cost (AVC) curves for a typical firm in the industry.
100
80
70
60
ATC
50
40
3.
30
20
AVC
10
MCO
10 15 20 2s 30 35 40 45 50
QUANTITY (Thousands of jackets)
For each price in the following table, use the graph to determine the number of jackets this firm would produce in order to maximize its profit. Assume
that when the price is exactly equal to the average variable cost, the firm is indifferent between producing zero jackets and the profit-maximizing
quantity. Also, indicate whether the firm will produce, shut down, or be indifferent between the two in the short run. Lastly, determine whether it will
make a profit, suffer a loss, or break even at each price.
Price
Quantity
Profit or Loss?
(Dollars per jacket)
(Jackets)
Produce or Shut Down?
10
20
32
40
50
60
Page 1 of 2
O words
O Focus
100%
3:36 PM
P Type here to search
37°F Cloudy
1)
W
11/11/2021
COSTS Dollars)
Expert Solution
This question has been solved!
Explore an expertly crafted, step-by-step solution for a thorough understanding of key concepts.

This is a popular solution!

Trending now
This is a popular solution!

Step by step
Solved in 3 steps with 2 images

Knowledge Booster


Learn more about
Need a deep-dive on the concept behind this application? Look no further. Learn more about this topic, economics and related others by exploring similar questions and additional content below.Recommended textbooks for you

Principles of Economics (12th Edition)
Economics
ISBN:
9780134078779
Author:
Karl E. Case, Ray C. Fair, Sharon E. Oster
Publisher:
PEARSON

Engineering Economy (17th Edition)
Economics
ISBN:
9780134870069
Author:
William G. Sullivan, Elin M. Wicks, C. Patrick Koelling
Publisher:
PEARSON
Principles of Economics (12th Edition)
Economics
ISBN:
9780134078779
Author:
Karl E. Case, Ray C. Fair, Sharon E. Oster
Publisher:
PEARSON
Engineering Economy (17th Edition)
Economics
ISBN:
9780134870069
Author:
William G. Sullivan, Elin M. Wicks, C. Patrick Koelling
Publisher:
PEARSON

Principles of Economics (MindTap Course List)
Economics
ISBN:
9781305585126
Author:
N. Gregory Mankiw
Publisher:
Cengage Learning

Managerial Economics: A Problem Solving Approach
Economics
ISBN:
9781337106665
Author:
Luke M. Froeb, Brian T. McCann, Michael R. Ward, Mike Shor
Publisher:
Cengage Learning

Managerial Economics & Business Strategy (Mcgraw-…
Economics
ISBN:
9781259290619
Author:
Michael Baye, Jeff Prince
Publisher:
McGraw-Hill Education