
Database System Concepts
7th Edition
ISBN: 9780078022159
Author: Abraham Silberschatz Professor, Henry F. Korth, S. Sudarshan
Publisher: McGraw-Hill Education
expand_more
expand_more
format_list_bulleted
Related questions
Concept explainers
Question
See the attached picture.
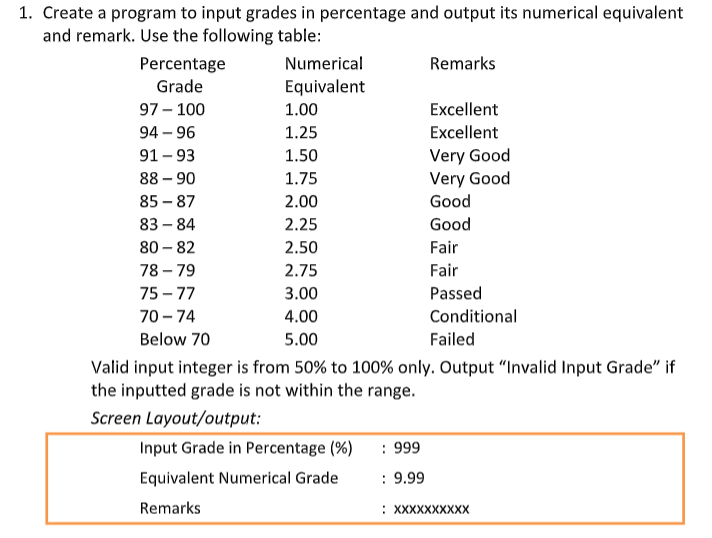

Transcribed Image Text:1. Create a program to input grades in percentage and output its numerical equivalent
and remark. Use the following table:
Percentage
Grade
97-100
94-96
91-93
88-90
85-87
83-84
80-82
78-79
75-77
70-74
Below 70
Numerical
Equivalent
1.00
1.25
1.50
1.75
2.00
2.25
2.50
2.75
3.00
4.00
5.00
Input Grade in Percentage (%)
Valid input integer is from 50% to 100% only. Output "Invalid Input Grade" if
the inputted grade is not within the range.
Screen Layout/output:
Equivalent Numerical Grade
Remarks
Remarks
Excellent
Excellent
: 999
: 9.99
Very Good
Very Good
Good
Good
Fair
Fair
Passed
Conditional
Failed
:XXXXXXXXXX
Expert Solution
This question has been solved!
Explore an expertly crafted, step-by-step solution for a thorough understanding of key concepts.

Step by stepSolved in 4 steps with 4 images

Knowledge Booster


Learn more about
Need a deep-dive on the concept behind this application? Look no further. Learn more about this topic, computer-science and related others by exploring similar questions and additional content below.Similar questions
- Use the Volts.txt file finding the Highest volt and lowest along with the amp and time of the occurrencearrow_forwardSo, one of these statements is correct? It is impossible to display on a single map several layers (data) using different coordinate systems. For GIS purposes, it is allowed for data to include several coordinate systems. A map may display several different layers of data, each with its own set of coordinates. A map's layers may not align correctly if you use several coordinate systems to display them. Those things are not includedarrow_forwardHow about the bottom image answer?arrow_forward
- Read the sunspot data file and produce a scatter plot of os sunspot countsfrom 1849 to 2023. Use a marker size of one, and make the marker face and edge colors the same.Label the horizontal axis with years. Plot all the data points for every day from 1840 to 2023. Create the numbers for the horizontal axis by extracting the year from the lines inthe data file. You can look at the peak finding example programs to see a use of scatter plots. This should be a fairly quick assignment. The next program will involve using the same sunspot data, appyingsmoothing, then finding and plotting the peaks and computing the period of the solar cycle.arrow_forwardGive a quick explanation of the character set.arrow_forwardCan you please explain more and the provided image is not showing as expectedarrow_forward
- Thank you. But can you use the parameters and the formula given in the image??arrow_forwardExplain how each of the three wrap attribute values of text areas work. View keyboard shortcutsarrow_forwardSo, are these statements correct? It is impossible to display on a single map several layers (data) using different coordinate systems. For GIS purposes, it is allowed for data to include several coordinate systems. A map may display several different layers of data, each with its own set of coordinates. A map's layers may not align correctly if you use several coordinate systems to display them. Those things are not includedarrow_forward
- Please written by computer source Create a histogram of the image. Note the dimensions are 300*300. Also equalize the histogram. DO IT ON PAPER NOT COMPUTER. SHOW ALL WORKarrow_forwardScaling by a fraction move the point closer to the origin True or falsearrow_forwardSplit the UI/UX divide. Create a catalog of the top methods.arrow_forward
arrow_back_ios
SEE MORE QUESTIONS
arrow_forward_ios
Recommended textbooks for you
- Database System ConceptsComputer ScienceISBN:9780078022159Author:Abraham Silberschatz Professor, Henry F. Korth, S. SudarshanPublisher:McGraw-Hill Education
 Starting Out with Python (4th Edition)Computer ScienceISBN:9780134444321Author:Tony GaddisPublisher:PEARSON
 Digital Fundamentals (11th Edition)Computer ScienceISBN:9780132737968Author:Thomas L. FloydPublisher:PEARSON
  C How to Program (8th Edition)Computer ScienceISBN:9780133976892Author:Paul J. Deitel, Harvey DeitelPublisher:PEARSON
 Database Systems: Design, Implementation, & Manag...Computer ScienceISBN:9781337627900Author:Carlos Coronel, Steven MorrisPublisher:Cengage Learning
 Programmable Logic ControllersComputer ScienceISBN:9780073373843Author:Frank D. PetruzellaPublisher:McGraw-Hill Education
Database System Concepts
Computer Science
ISBN:9780078022159
Author:Abraham Silberschatz Professor, Henry F. Korth, S. Sudarshan
Publisher:McGraw-Hill Education
Starting Out with Python (4th Edition)
Computer Science
ISBN:9780134444321
Author:Tony Gaddis
Publisher:PEARSON
Digital Fundamentals (11th Edition)
Computer Science
ISBN:9780132737968
Author:Thomas L. Floyd
Publisher:PEARSON
C How to Program (8th Edition)
Computer Science
ISBN:9780133976892
Author:Paul J. Deitel, Harvey Deitel
Publisher:PEARSON
Database Systems: Design, Implementation, & Manag...
Computer Science
ISBN:9781337627900
Author:Carlos Coronel, Steven Morris
Publisher:Cengage Learning
Programmable Logic Controllers
Computer Science
ISBN:9780073373843
Author:Frank D. Petruzella
Publisher:McGraw-Hill Education