1. We want to know if the timing of the first blooms on Japanese Cherry trees is dependent on the coolness of the weather. The table below contains the average temperature in March (Celsius) and the day of April when the first blossom appeared for a 24-year time period. X = average temperature in March; y = day in April of first bloom y y 4.0 14 4.9 9 4.5 10 5.4 8 3.8 14 4.1 17 3.2 4.0 13 6.1 3 2.6 19 5.1 11 6.2 4.2 14 4.3 13 5.1 11 4.7 1.5 28 5.0 4.9 14 3.7 17 4.6 4.0 21 3.8 19 4.0 11 a) Graph the data. Look at your scatterplot – does this data set show a correlation? If so, what how would you describe the correlation (strength, direction)? Which function family would you use to describe this? b) Find the equation of the regression equation that would best describe this data. What is this equation? 3. 11 14
1. We want to know if the timing of the first blooms on Japanese Cherry trees is dependent on the coolness of the weather. The table below contains the average temperature in March (Celsius) and the day of April when the first blossom appeared for a 24-year time period. X = average temperature in March; y = day in April of first bloom y y 4.0 14 4.9 9 4.5 10 5.4 8 3.8 14 4.1 17 3.2 4.0 13 6.1 3 2.6 19 5.1 11 6.2 4.2 14 4.3 13 5.1 11 4.7 1.5 28 5.0 4.9 14 3.7 17 4.6 4.0 21 3.8 19 4.0 11 a) Graph the data. Look at your scatterplot – does this data set show a correlation? If so, what how would you describe the correlation (strength, direction)? Which function family would you use to describe this? b) Find the equation of the regression equation that would best describe this data. What is this equation? 3. 11 14

MATLAB: An Introduction with Applications
6th Edition
ISBN:9781119256830
Author:Amos Gilat
Publisher:Amos Gilat
Chapter1: Starting With Matlab
Section: Chapter Questions
Problem 1P

Related questions
Question
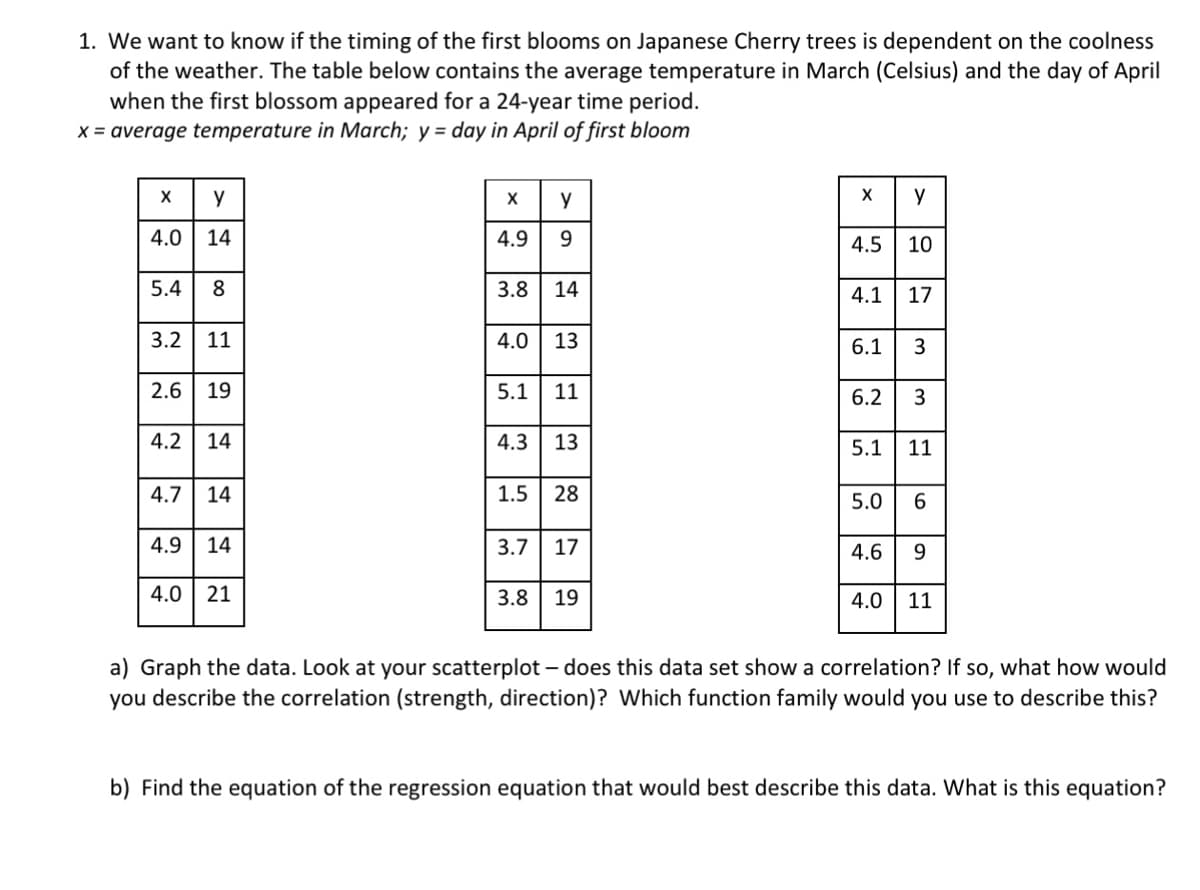
Transcribed Image Text:1. We want to know if the timing of the first blooms on Japanese Cherry trees is dependent on the coolness
of the weather. The table below contains the average temperature in March (Celsius) and the day of April
when the first blossom appeared for a 24-year time period.
X = average temperature in March; y = day in April of first bloom
y
y
y
4.0
14
4.9
4.5
10
5.4
8
3.8
14
4.1
17
3.2
11
4.0
13
6.1
3
2.6
19
5.1
11
6.2
3
4.2
14
4.3
13
5.1
11
4.7
14
1.5
28
5.0
4.9
14
3.7
17
4.6
9.
4.0
21
3.8
19
4.0
11
a) Graph the data. Look at your scatterplot – does this data set show a correlation? If so, what how would
you describe the correlation (strength, direction)? Which function family would you use to describe this?
b) Find the equation of the regression equation that would best describe this data. What is this equation?
| 00 |으
Expert Solution
This question has been solved!
Explore an expertly crafted, step-by-step solution for a thorough understanding of key concepts.

This is a popular solution!

Trending now
This is a popular solution!

Step by step
Solved in 3 steps with 8 images

Recommended textbooks for you
MATLAB: An Introduction with Applications
Statistics
ISBN:
9781119256830
Author:
Amos Gilat
Publisher:
John Wiley & Sons Inc

Probability and Statistics for Engineering and th…
Statistics
ISBN:
9781305251809
Author:
Jay L. Devore
Publisher:
Cengage Learning

Statistics for The Behavioral Sciences (MindTap C…
Statistics
ISBN:
9781305504912
Author:
Frederick J Gravetter, Larry B. Wallnau
Publisher:
Cengage Learning
MATLAB: An Introduction with Applications
Statistics
ISBN:
9781119256830
Author:
Amos Gilat
Publisher:
John Wiley & Sons Inc
Probability and Statistics for Engineering and th…
Statistics
ISBN:
9781305251809
Author:
Jay L. Devore
Publisher:
Cengage Learning
Statistics for The Behavioral Sciences (MindTap C…
Statistics
ISBN:
9781305504912
Author:
Frederick J Gravetter, Larry B. Wallnau
Publisher:
Cengage Learning

Elementary Statistics: Picturing the World (7th E…
Statistics
ISBN:
9780134683416
Author:
Ron Larson, Betsy Farber
Publisher:
PEARSON

The Basic Practice of Statistics
Statistics
ISBN:
9781319042578
Author:
David S. Moore, William I. Notz, Michael A. Fligner
Publisher:
W. H. Freeman

Introduction to the Practice of Statistics
Statistics
ISBN:
9781319013387
Author:
David S. Moore, George P. McCabe, Bruce A. Craig
Publisher:
W. H. Freeman