1.0 MS2 T4 E. coli 0.5 10-4 10-3 102 10' 1 10 102 10 104 Cot (mole x sec/L) b.) This next figure compares the DNA from two bacteriophages (MS2 and T4) and a bacterium (E. coli). The genome sizes are as follows: MS2 3569bp; T4 168, 903bp; E. coli ~- 600, 000bp. Describe the relationship of the three different curves to each other. ii. Explain this relationship in terms of genome size. i. c.) When half of the DNA in the sample is double-stranded, that point is termed the half- Fraction remaining single-stranded (C/C,)
1.0 MS2 T4 E. coli 0.5 10-4 10-3 102 10' 1 10 102 10 104 Cot (mole x sec/L) b.) This next figure compares the DNA from two bacteriophages (MS2 and T4) and a bacterium (E. coli). The genome sizes are as follows: MS2 3569bp; T4 168, 903bp; E. coli ~- 600, 000bp. Describe the relationship of the three different curves to each other. ii. Explain this relationship in terms of genome size. i. c.) When half of the DNA in the sample is double-stranded, that point is termed the half- Fraction remaining single-stranded (C/C,)

Human Heredity: Principles and Issues (MindTap Course List)
11th Edition
ISBN:9781305251052
Author:Michael Cummings
Publisher:Michael Cummings
Chapter8: The Structure, Replication, And Chromosomal Organization Of Dna
Section: Chapter Questions
Problem 14QP: State the properties of the WatsonCrick model of DNA in the following categories: a. number of...

Related questions

Question
Transcribed Image Text:1.0
MS2
T4
E. coli
0.5
104 103 102 10-
10' 102 103 10*
1
Cot (mole x sec/L)
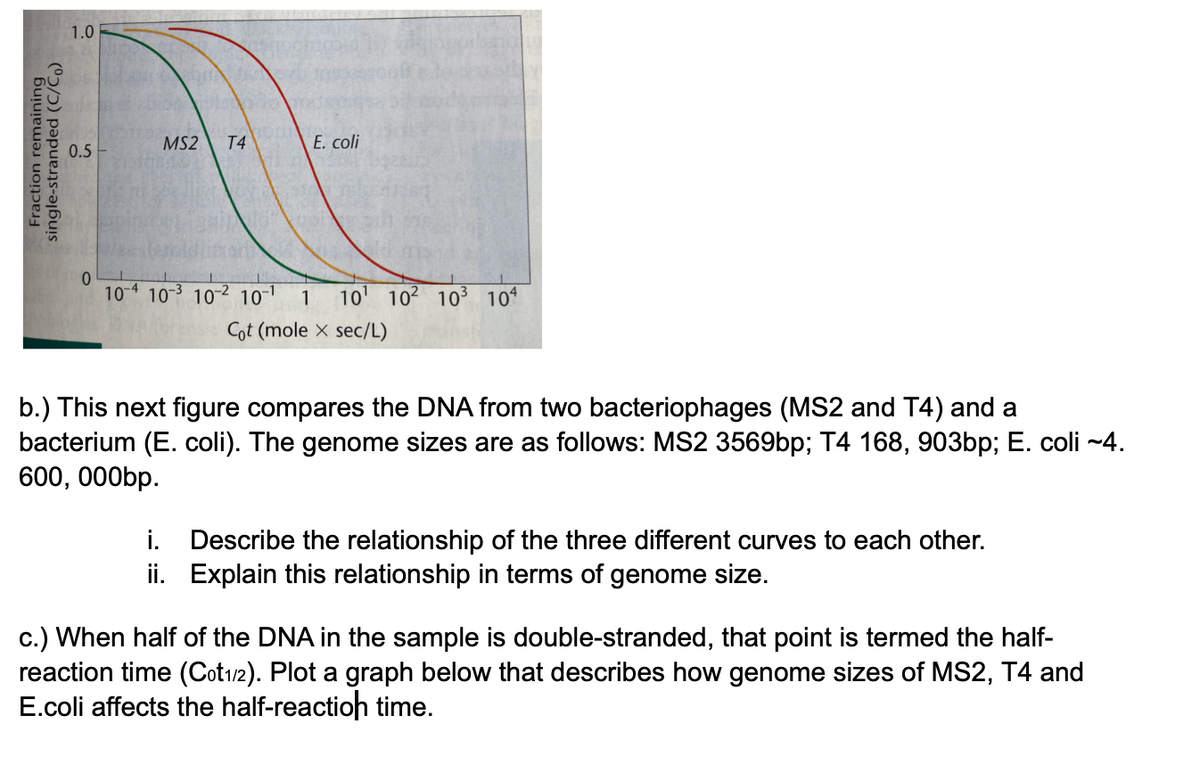
b.) This next figure compares the DNA from two bacteriophages (MS2 and T4) and a
bacterium (E. coli). The genome sizes are as follows: MS2 3569bp; T4 168, 903bp; E. coli -~4.
600, 000bp.
i. Describe the relationship of the three different curves to each other.
ii. Explain this relationship in terms of genome size.
c.) When half of the DNA in the sample is double-stranded, that point is termed the half-
reaction time (Cot12). Plot a graph below that describes how genome sizes of MS2, T4 and
E.coli affects the half-reactioh time.
Fraction remaining
single-stranded (C/Čo)
Transcribed Image Text:0.5
104
10 102 10 1 10' 10² 103³ 10*
Cot (mole × sec/L)
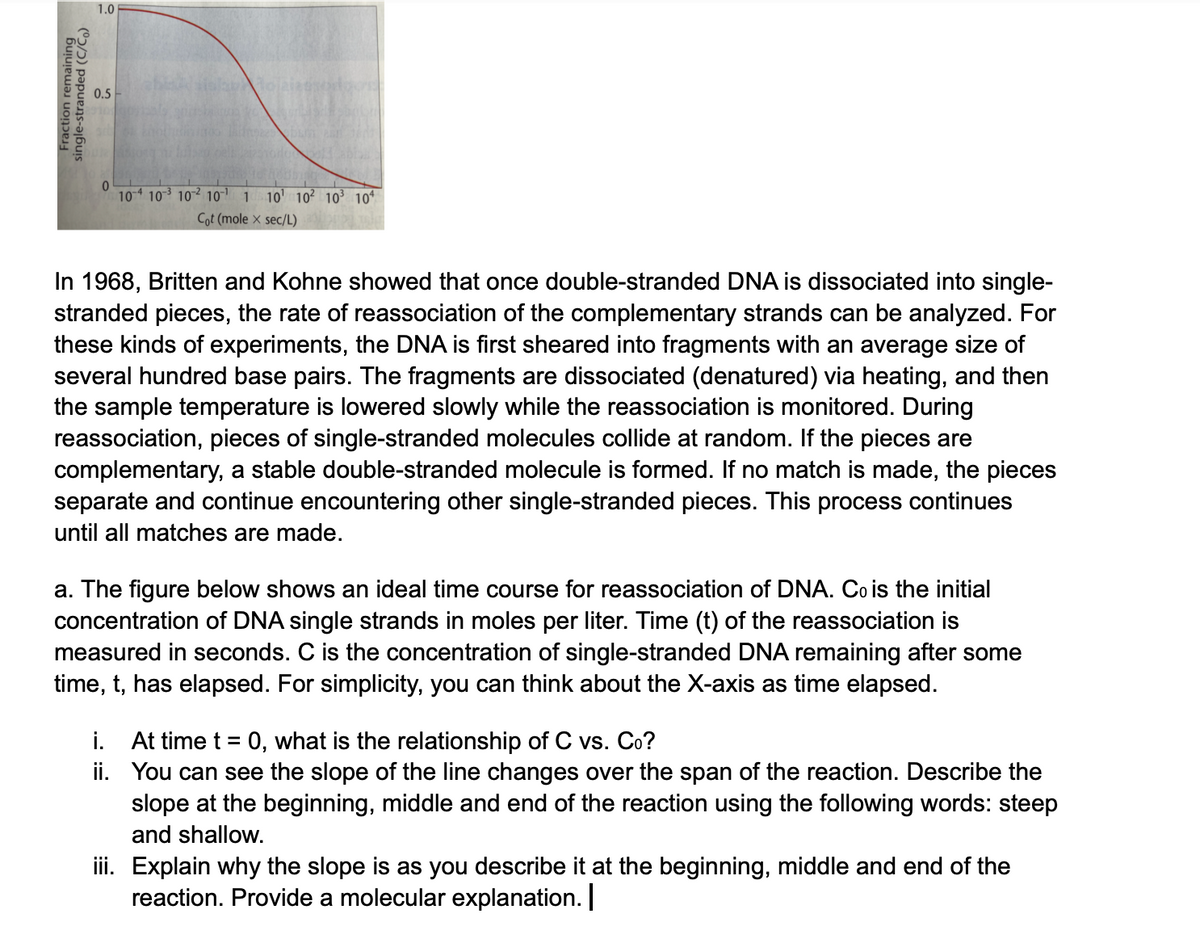
In 1968, Britten and Kohne showed that once double-stranded DNA is dissociated into single-
stranded pieces, the rate of reassociation of the complementary strands can be analyzed. For
these kinds of experiments, the DNA is first sheared into fragments with an average size of
several hundred base pairs. The fragments are dissociated (denatured) via heating, and then
the sample temperature is lowered slowly while the reassociation is monitored. During
reassociation, pieces of single-stranded molecules collide at random. If the pieces are
complementary, a stable double-stranded molecule is formed. If no match is made, the pieces
separate and continue encountering other single-stranded pieces. This process continues
until all matches are made.
a. The figure below shows an ideal time course for reassociation of DNA. Co is the initial
concentration of DNA single strands in moles per liter. Time (t) of the reassociation is
measured in seconds. C is the concentration of single-stranded DNA remaining after some
time, t, has elapsed. For simplicity, you can think about the X-axis as time elapsed.
i. At time t = 0, what is the relationship of C vs. Co?
ii. You can see the slope of the line changes over the span of the reaction. Describe the
slope at the beginning, middle and end of the reaction using the following words: steep
and shallow.
iii. Explain why the slope is as you describe it at the beginning, middle and end of the
reaction. Provide a molecular explanation.
Expert Solution
This question has been solved!
Explore an expertly crafted, step-by-step solution for a thorough understanding of key concepts.

Step by step
Solved in 2 steps

Knowledge Booster


Learn more about
Need a deep-dive on the concept behind this application? Look no further. Learn more about this topic, biology and related others by exploring similar questions and additional content below.Recommended textbooks for you
Human Heredity: Principles and Issues (MindTap Co…
Biology
ISBN:
9781305251052
Author:
Michael Cummings
Publisher:
Cengage Learning

Concepts of Biology
Biology
ISBN:
9781938168116
Author:
Samantha Fowler, Rebecca Roush, James Wise
Publisher:
OpenStax College
Human Heredity: Principles and Issues (MindTap Co…
Biology
ISBN:
9781305251052
Author:
Michael Cummings
Publisher:
Cengage Learning
Concepts of Biology
Biology
ISBN:
9781938168116
Author:
Samantha Fowler, Rebecca Roush, James Wise
Publisher:
OpenStax College