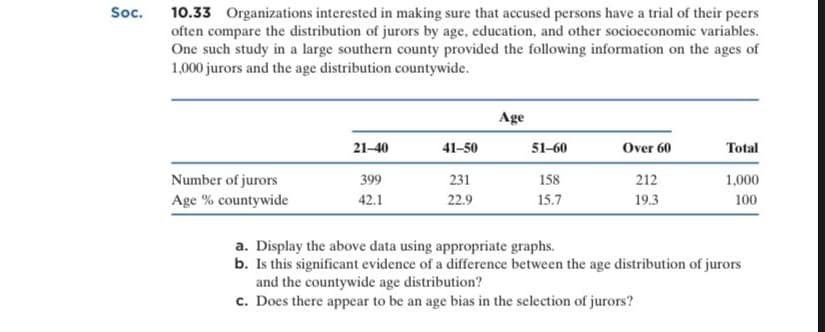
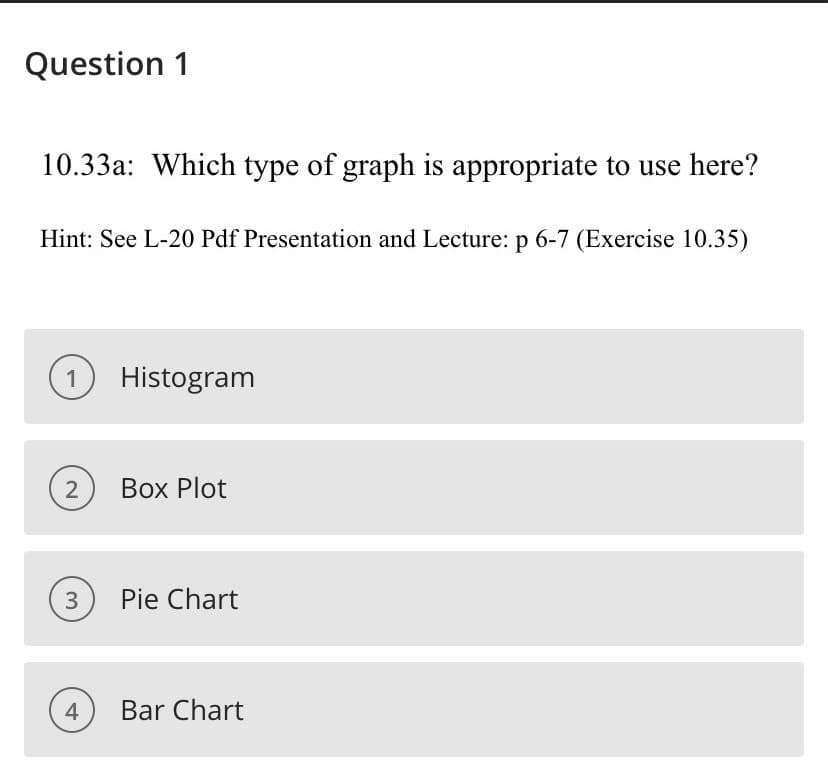
10.33a: Which type of graph is appropriate to use here? Hint: See L-20 Pdf Presentation and Lecture: p 6-7 (Exercise 10.35) 1 Histogram 2 Box Plot 3 Pie Chart Bar Chart 4.


Q: The Internet The NAEP report described in Exercise 39compared science scores for students who had…
A: a) When we say that a test is statistically Significant, we mean that the test statistic had a…
Q: The table below gives information about some activities that children at Franklin Elementary say…
A: The basic premise is that pie charts are poor at communicating data. They take up more space and are…
Q: Use the graph below to answer the questions that follow: Scores on a basic Math Test 1 40 50 60 70…
A: A graph is given showing the relationship between students and their scores obtained on a basic math…
Q: The following data values are the duration times in minutes of all missions flown by a space…
A: Given n=10 x 4 7066 8611 8894 9967 10110 10157 11419 11500 11835
Q: Use the data in the table below to complete parts (a) through (c). 7 7 10 14 18 18 42 30 38 22 25 27…
A: Given data, x y 5 30 7 38 7 22 10 25 14 27 18 22 18 20 42 3
Q: Given the following graph, which of the following explains why there are no children 46 inches tall?…
A: To find the correct option
Q: Consider the following graph. V(G) = {v1, v2, v3, v4}, e(G) = {e1, e2, e3, e4, e5}, E(G) =…
A:
Q: an you tell how old a lobster is by its size? This question was investigated by the authors of a…
A: Form the given information, Researchers measured carapace (the exterior shell) length of 27…
Q: 2) The data below is the heart rate, in beats per minute, from 18 individuals after two minutes of…
A: Note: Since you have posted a question with multiple subparts, we will solve the first three…
Q: 22. Christina decides to track how her daughter's height increases each month, starting when she is…
A:
Q: Which statements are true about the graph below? (Answer all that apply) .:. 0 2 4 6 8 10 12 14 16…
A: From the graph it is clear that the tail of the distribution is elongated to the right sided.
Q: Kids and Guns The following data show where children obtain guns for committing crimes. Source…
A: The data, where children obtain guns for committing crimes, are given.
Q: In a class of twenty-four students 12 students made a B, 6 students made a C, 3 students made a A,…
A: Tabulate data in Excel as shown below. Select this table and Go to Insert and select 2 D clustered…
Q: Body Temperatures Listed below are the temperatures from nine males measured at 8 AM and again at 12…
A: Given data:
Q: Please see attached. Thank you
A:
Q: Give a brief analysis on the graph given in the picture by using the data (Dominant behaviors of…
A: From the given graph, The dominant behaviors are given for treatment 1 and treatment 2. From the…
Q: Num ber of Students 11 Bailey surveyed a group of students to choose their favorite type of movie…
A: A bar chart or bar graph is a chart or graph that presents categorical data with rectangular bars…
Q: The coach of a track team surveyed the team members on how long they slept the night before a race.…
A: In the given question there are two graphs a scatterplot and a histogram. A scatter plot has "number…
Q: 6. The table below shows last semester’s cumulative scores for the seven students sitting closest to…
A: Given Information: Consider the provided table that shows the cumulative scores of the students who…
Q: What score could we predict from a learner who studied 5 hours? 100 90 80 70 60 50 40 30 20 10…
A: This question can be answered just by analysing the given graph
Q: The double box plot shows the amount of money spent by Sheila and Susan on their last ten shopping…
A: Given that, Double box plot shows the amount of money spent by Sheila ans Susan on last 10 shopping…
Q: The Effect of Relaxation Training on Anxiety Scores Group Mean Anxiety Score SE Control group…
A: Given Group mean anxiety Score SE Control group 36 7 Relaxation training 18 5
Q: Data Set I 41 44 45 47 47 48 51 53 58 66 Data Set II 20 37 48 48 49 50 53 61 64 70
A: Data can be raw or grouped, with some pros and cons associated with both of them. Raw data have each…
Q: The table available below shows the drive through service times (seconds) for lunches at a fast food…
A: Given dataA table is given and it shows the drive through service times for lunches at fast food…
Q: SUBJECT HAND TESTED REACTION SUBJECTHAND TESTED REACTION T7ME T7ME R R 26 24 1 .25 .22 R R .24 ,21…
A: Consider the provided data in the study. Handedness R L Left hand tested 0.26 0.24 0.24 0.21…
Q: 2. Select the line of best fit for the data. Justify your choice. Graph A Graph B y y
A:
Q: Determine the type of misleading that the graph commit. Choose the best answer. COST OF GAS NATIONAL…
A:
Q: Q3: Draw the Multi-bar Graph of the following Data Week / Week-1 Week-2 Week-3 Week-4 (Prices of…
A: Q3. Step-by-step procedure to draw the Multiple bar graph using Excel: In Excel sheet, enter and…
Q: Window Below are two snapshots of data taken from the covid19.nj.gov website on January 8, 2021.…
A: Interpretation of Data: Data that are in the piechart interprets that the data is of those many…
Q: Which statements are true about the graph below? (Answer all that apply) :.:. 2 4 8 10 12 14 16…
A:
Q: I need help determining what graphs to use for what reason. .. (there can be more than one…
A: Here we need to determinea graph which is suitable to analyse major field of study for a group of…
Q: Give a brief analysis on the graph given in the picture by using the data (Dominant behaviors of…
A: From the given graph, The dominant behaviors are given for treatment 1 and treatment 2. From the…
Q: A scientist recorded the number of mosquitoes caught in a trap at a particular location every day…
A: The question is about identifying the histogram using the shape of the dist. Given : Shape of the…
Q: A researcher is interested in exploring the relationship between lengths and weights of low birth…
A: We need to graph a scatter plot.
Q: 1 Consider the following box plots and select all answers that Starting salaries Female Male apply.…
A: Introduction: The five-number summary that are used to draw the boxplot are the minimum, first…
Q: b) Below are some of the findings you collected from the survey of the 35 students sampled at UBL.…
A: 35 students were sampled. The number of female respondents is given as: 65% of n(total number…
Q: 5.1 5) Look at the school lunch graph created by some students: a) In what way is this graphical…
A: Given information: Variable of interest=Favourite school lunchNo. of lunch=02Lunch=1.Pizza.2.Chicken…
Q: A battery manufacturer is interested in the lifetime of its products. Thirty batteries are tested…
A: The following data of number of hours 30 batteries last long are given as: 41.3 21.1 35.6 13.5…
Q: 2. The table below shows the number of pounds of each snack food eaten during the during NBA Finals.…
A: Given table showing the number of pounds of snacks eaten is:
Q: Studente' Favorite After-Sebool Aetivities Aetivity Play Sports Talk on Phone Wait With Frienda Bam…
A: Rewrite the given information as percent as shown below, Activity Number of students Percentage…
Q: 152. Which of the following statements best supports the data provided in the line graph? Students…
A: the following graph represent the Students per Computer in U.S. Public Schools,
Q: Construct a scatterplot. Choose the correct graph below. OA. O B. Oc. OD. 200- 200- 200- 200- 160…
A: Given: President's height Opponent's height 171 191 181 175 182 188 187 180 174 187…
Q: The following graph shows the standard curve for a particular instrument. The of best fit is…
A: The graph of the particular instrument is given.
Q: So, take the EXCEL output of the following and write the interpretation. • Appropriate type of Graph…
A: This is the scatter plot of sales and advertisements by this we can see all points pointed upwards…
Q: Given the following graph, which statement is accurate about individuals who work more than 8 hours…
A: From the given graph, For individuals more than 8 hours worked, number of gym hours increases.
Q: This graph is from a study evaluating an opioid drug and gender on pain levels. Which of the…
A: Interaction effect means the effect of one independent variable on the other dependent variable…
Q: Use the graph below to answer the questions that follow: Scores on a basie Math Test 40 50 60 70 80…
A: We have to find answer by using this graph...
i need MCQ solution


Trending now
This is a popular solution!

Step by step
Solved in 2 steps

- The types of browse favored by deer are shown in the following table. Using binoculars, volunteers observed the feeding habits of a random sample of 320 deer.Type of Browse Plant Compositionin Study Area Observed Number of DeerFeeding on This PlantSage brush 32% 98 Rabbit brush 38.7% 134 Salt brush 12% 38 Service berry 9.3% 27 Other 8% 23 A button hyperlink to the SALT program that reads: Use SALT.Use a 5% level of significance to test the claim that the natural distribution of browse fits the deer feeding pattern.(a) What is the level of significance? State the null and alternate hypotheses.H0: The distributions are the same.H1: The distributions are the same.H0: The distributions are different.H1: The distributions are different. H0: The distributions are the same.H1: The distributions are different.H0: The distributions are different.H1: The distributions are the same. (b) Find the value of the chi-square statistic for the sample. (Round the expected frequencies to at least three…The manager of a company that assembles and exports a particular type of pumps wants to know if there is a link between the number of hours spent by assembly workers in training and their productivity on the job. A random sample of 7 assembly workers was selected and their performances evaluated. The summary of the obtained data is listed in Table 2. Table 2: Shows the time spend by workers during training and their productivity on jobTraining hours (x) 20 36 20 38 40 33 32Output (y) 40 70 44 56 60 48 62 (i) Construct a scatter plot of the sample data and comment on the relationship between hours of training and output. (ii) Estimate a simple regression line, using the method of least squares, to identify a linear relationship between the hours of training received by assembly workers and their output (i.e. number of units assembled per day). (iii) Interpret, in context, the gradient/slope of the regression line. (iv) Estimated the output at 20 hours training time. (v) Interpret the…An online clothing retailer is testing a new e-mail campaign by sending one version of the e-mail with the word “free” in the subject line (version A) to a group of 1,500 customers and another version of the e-mail with word “discount” in the subject line (version B) to a different group of 1500 customers. After tracking the responses to the two versions of the e-mail advertising, the retailer finds that 75 responded to version A and 105 responded to version B. At 0.05 significance level, can it be concluded that the response rate for version B is higher than the response rate to version A What is your decision? Enter “R” if your decision is to reject the null hypotheses. Enter “F” if the decision is fail to/do not reject the null hypotheses. Your answer (R/F) is: Which of the followings is the most appropriate conclusion for the hypotheses test? Enter the number corresponding to the most appropriate conclusion in the answer box. For example, if statement number 2 is the most…
- An online clothing retailer is testing a new e-mail campaign by sending one version of the e-mail with the word “free” in the subject line (version A) to a group of 1,500 customers and another version of the e-mail with word “discount” in the subject line (version B) to a different group of 1500 customers. After tracking the responses to the two versions of the e-mail advertising, the retailer finds that 75 responded to version A and 105 responded to version B. At 0.05 significance level, can it be concluded that the response rate for version B is higher than the response rate to version A Determine which of the following formulations of the hypotheses is appropriate and enter the corresponding number in the answer text box. Index “a” refers to the population of the customers who respond to version A and index “b” refers to the population of customers who are responsive to version B. Identify and enter the number corresponding to the most appropriate formulation for the…NutritionResearchers compared protein intake among threegroups of postmenopausal women: (1) women eating astandard American diet (STD), (2) women eating a lactoovo-vegetarian diet (LAC), and (3) women eating a strictvegetarian diet (VEG). The mean ± 1 sd for protein intake(mg) is presented in Table 12.29. 12.5 Using the data in Table 12.29, perform a multiplecomparisons procedure to identify which specific underlyingmeans are different.A statistical program is recommended. Jensen Tire & Auto is in the process of deciding whether to purchase a maintenance contract for its new computer wheel alignment and balancing machine. Managers feel that maintenance expense should be related to usage, and they collected the following information on weekly usage (hours) and annual maintenance expense (in hundreds of dollars). Weekly Usage(hours) AnnualMaintenanceExpense 13 17.0 10 22.0 20 30.0 28 37.0 32 47.0 17 30.5 24 32.5 31 39.0 40 51.5 38 40.0 #1) Develop the estimated regression equation that could be used to predict the annual maintenance expense (in hundreds of dollars) given the weekly usage (in hours). (Round your numerical values to two decimal places.) #2) The expected expense of a machine being used 34 hours per week is $ hundred.
- A sociologist wants to investigate the question, "Is there a relationship between texting during class and grade-point-average (GPA) among high school seniors in a large district?" Which study design is most appropriate? Before the semester starts, randomly select 40 seniors from each high school who do not text during class. Assign 20 to the texting treatment group (text three or more times during every class meeting) and 20 to the control group (no texting during class). At the end of the semester, obtain each student’s GPA from the appropriate admissions and records office. Compare the GPA of students who routinely text during class to the GPA of students who do not text during class. Before the semester starts, randomly select 40 seniors from each high school who do not text during class. Assign 20 to the texting treatment group (text three or more times during every class meeting) and 20 to the control group (no texting during class). At the end of the semester,…As part of a study on transportation safety, the U.S. Department of Transportation collected data on the number of fatal accidents per 1000 licenses and the percentage of licensed drivers under the age of 21 in a sample of 42 cities. Data collected over a one-year period follow. These data are contained in the file Safety. PercentUnder 21 Fatal Accidentsper 1000 13 2.962 12 0.708 8 0.885 12 1.652 11 2.091 17 2.627 18 3.83 8 0.368 13 1.142 8 0.645 9 1.028 16 2.801 12 1.405 9 1.433 10 0.039 9 0.338 11 1.849 12 2.246 14 2.855 14 2.352 11 1.294 17 4.1 8 2.19 16 3.623 15 2.623 9 0.835 8 0.82 14 2.89 8 1.267 15 3.224 10 1.014 10 0.493 14 1.443 18 3.614 10 1.926 14 1.643 16 2.943 12 1.913 15 2.814 13 2.634 9 0.926 17 3.256 d. Give a 95% interval estimate of the number of fatal accidents per 1000 licenses in a city where 15% of the licensed drivers are under 21.As part of a study on transportation safety, the U.S. Department of Transportation collected data on the number of fatal accidents per 1000 licenses and the percentage of licensed drivers under the age of 21 in a sample of 42 cities. Data collected over a one-year period follow. These data are contained in the file Safety. PercentUnder 21 Fatal Accidentsper 1000 13 2.962 12 0.708 8 0.885 12 1.652 11 2.091 17 2.627 18 3.83 8 0.368 13 1.142 8 0.645 9 1.028 16 2.801 12 1.405 9 1.433 10 0.039 9 0.338 11 1.849 12 2.246 14 2.855 14 2.352 11 1.294 17 4.1 8 2.19 16 3.623 15 2.623 9 0.835 8 0.82 14 2.89 8 1.267 15 3.224 10 1.014 10 0.493 14 1.443 18 3.614 10 1.926 14 1.643 16 2.943 12 1.913 15 2.814 13 2.634 9 0.926 17 3.256 a. What is the value of the standard error of the estimate? b. Test for a significant relationship (show all appropriate steps). Use α = .05. c. Give a 95% interval estimate of the…
- In a project for a botany class, 15 sunflower seeds were randomly assigned to and planted inpots whose soil had been subjected to one of three fertilizer treatments. Twelve of the seedsgerminated, and the table below shows the height of each plant (in cm) 2 weeks aftergermination. Test at the 5% significance level whether there is any association between brandand customer satisfaction level.Treatment 1 Treatment 2 Treatment 325 40 3626 37 2531 30 2635 33 2437 25 24A travel agency is interested in finding out if different age groups frequent different Spring Break destinations, in order to better target the appropriate audiences. A random sample of college Spring Break vacationers produces the results given in the table below. Is there enough evidence at the 0.025 level of significance to show that there is a relationship between age (by college classification) and destination? Observed Sample of College Students Beach Mountains City Home Total Freshman 28 17 20 22 87 Sophomore 24 14 15 3 56 Junior 24 15 17 15 71 Senior 10 12 3 12 37 Total 86 58 55 52 251 Step 3 of 4: Compute the value of the test statistic. Round your answer to three decimal places, if necessary. (Note: If calculating by hand, be sure to use at least six decimal places in numbers for all intermediate calculations to ensure accuracy of the result.) Step 4 of 4: Draw a conclusion and interpret the decision7.15 A soft-drink firm is evaluating an investment in a new type of canning machine. The company has already determined that it will be able to fill more cans per day for the same cost if the new machines are installed. However, it must determine the variability of fills using the new machines and wants the variability from the new machines to be equal to or smaller than that currently obtained using the old machines. A study is designed in which random samples of 40 cans are selected from the output of both types of machines and the amount of fill (in ounces) is determined. The data are given below. Old Machine 16.74 15.75 16.19 16.54 15.92 16.29 16.44 16.29 16.38 16.47 16.56 16.42 16.08 16.47 16.02 16.74 15.97 16.47 16.06 16.64 16.40 16.40 16.28 16.66 16.80 16.36 16.36 16.27 16.43 16.26 16.31 16.59 16.24 16.63 16.15 16.17 16.32 16.81 16.27 17.09 New Machine 15.64 15.81 16.20 16.36 16.36 16.05 16.07 16.04 16.08 16.31 16.50 16.14 16.12 16.30 16.41 16.11 16.20 16.29…


