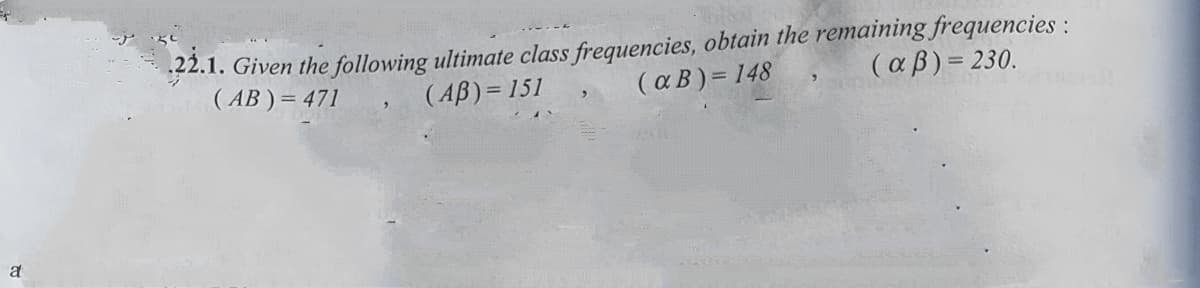
2.1. Given the following ultimate class frequencies, obtain the remaining frequencies : ( αB ) = 148 (AB ) = 471 (AB)= 151 (αβ) = 230.


Q: In a population with o = 6, a score of X = 48 corresponds to z = 1.25. The mean for this population…
A: From the provided information, Standard deviation (σ) = 6 Z value = 1.25 And X = 48
Q: The following is a list of 4 measurements. 15, 13, 15, 18 Send data to calculator Suppose that these…
A:
Q: Lec 6.1. Defer mine minímun sada number o such that P x) estimates fue)= smx of interpolating points…
A: To find - Determine minimum number of interpolating points (n) such that Pn-1x estimates fx = sinx…
Q: The table shows data for bus arrivals at one stop. By H
A: Given : A data table regarding bus timings. To find : Expected minutes of late
Q: 16. The following table shows the results of a study on smoking and three illnesses. We are…
A: Given Information: Consider the given dataset: Emphysema Heart Problem Cancer Total Smoker…
Q: 4. Various state and national automobile associations regularly survey gasoline stations to…
A: In the given context, the population is all the gasoline stations in United States and the sample is…
Q: Suppose we want both the sensitivity and specificity to be at least 70%. Use the ROC curve to…
A: Given information: The relationship of clinical dementia to outcome on the Chinese Mini-Mental…
Q: 4. For a population with u= 100 and o = 20, what is the X value corresponding to z=- 0.75?
A: GivenMean(μ)=100standard deviation(σ)=20z=-0.75
Q: 2. (2) Consider the wage equation In(wage) A+BEDUC + B,EDUC +B,EXPER+B,EXPER+B.(EDUC EXPER)+e where…
A: "Since you have posted a question with multiple sub-parts, we will solve the first three sub-parts…
Q: 29. Eleven cities are ranked according the their pollution levels and occurrence of pulmonary…
A:
Q: Consider the following scatter diagram: 25 20 15 10 Initial Which of the following best describes…
A: A scatter plot is given between initial and final temperatures.
Q: The mean GPA of all 4000 students at a college is 2.69. A sample of 150 GPAS from this school has a…
A: The characteristic of the population is known as parameter and the characteristic of the sample is…
Q: utrition The mean ±1 sd of In [calcium intake (mg)] among 25 females, 12 to 14 years of age, below…
A: Note: Hey, since there are multiple questions posted, we will answer first question. If you want any…
Q: 8. 4. 2. 4. 8. Given the contour graph of f(r, y) shown above estimate ff f (r,y) dA with R = [2, 5]…
A: For given contour graph of fx,y, to estimate ∬Rfx,ydA with R=2,5×3,7 using m=n=2 and midpoints as…
Q: Given are the scores of 10 employees from their 20-point assessment 16 18 10 8 12 15 19 17 167…
A:
Q: (1) Let X = b(16,) find E(4-3x) and distribution function.
A: From the provided information, X~b (16, 1/4) Sample size (n) = 16 Probability (p) = 1/4
Q: 4. Suppose that Đ, and Əz are unbiased estimators of the parameters 0. We know that V(é,) = 20 and…
A:
Q: Examine the following figure, which displays hypothetical measurements of a sample of individuals…
A: Horizontal axis : A,B,C Vertical axis : 0 to 10 (with gap of 2.5) A ( majority lie between 1 to 5,…
Q: Suppose that X and Y are unknown with E(X) = 20, Var (X) = 4 , E(Y) = 12, and Var (Y) = 16. In…
A: It is given that, E(X) = 20, Var (X) = 4 and E(Y) = 12, and Var (Y) = 16 and E(XY) = 248
Q: Given are the scores of 10 employees from their 20-point assessment 16 18 10 8 12 15 19 17 16 7…
A:
Q: 4. The ages of students in a night class on gerontology were collected with the following results: X…
A: Confidence interval: The following is the formula for Confidence interval about true population…
Q: The table below lists measured amounts (mg) of tar, carbon monoxide (CO), and nicotine in king size…
A: Hello! As you have posted more than 3 sub parts, we are answering the first 3 sub-parts. In case…
Q: Some tests were carried out on a newly designed carburetor. Four variables were studied as follows:
A: Given information: The variables in the given study are: A = Tension on spring B = Air gap C = Size…
Q: (1) Let X b(16, find E(4-3x) and distribution function.
A:
Q: (a) Compute E(Y). E(Y) = (b) Suppose an individual with Y violations incurs a surcharge of $90Y2.…
A: 1) It is given that the random variable Y denote the number of moving violations for which the…
Q: 1. The average normal daily temperature ( in degree Celsius) and the corresponding average monthly…
A: Given data is Temperature(x) 30 27 28 32 27 23 18 Precipitation(y) 3.4 1.8 3.5 3.6 3.7 1.5 0.2
Q: Given that n=82 data points are collected when studying the relationship between average daily…
A: It is given that sample size (n) is 82, and r is -0.974.Thus,The degree of freedom (df) is:
Q: A. Compute the z for each given the following: 1. Claimed proportion = 0.2, Sample proportion =…
A: “Since you have posted a question with multiple sub-parts, we will solve the first three subparts…
Q: (a) If the sum of the deviations of the numbers X1, X2, X3, ....., Xn from their mean, X, is zero.…
A:
Q: 2.4. How many parameters must be estimated? 2.5. Give the fitted response function used to get the…
A: 2.4GivenThe degree of freedom for regression from given output a=6a=k-1, where k is number of…
Q: We know that the point estimator o` is an unbiased estimator for the parameter 0 if E(e') = 0.If the…
A: Unbiased estimator: Any statistic is said to be an unbiased estimator of the specified parameter, if…
Q: LEM 20 Show that the effective noise temperature of 'n' networks in cascade is given by, T…
A: Answer: For the given data,
Q: A sample of n = 25 scores has a mean of M = 68. Find the z-score for the sample: If it was obtained…
A: Given that, M=68,μ=60,σ=10,n=25 The z-score for the sample is, Hence, the z-score for the sample…
Q: Calculate each of the following: 1. The Average 2. The Range 3. XGA 4. RA 5. Lower Control Limit…
A: Note: Hi there! Thank you for posting the question. As your question has more than 3 parts, we have…
Q: For Numbers 9 and 10: Clean precipitation has a pH of 5.0 to 5.5 but in a certain county,…
A: Hypothesis for shapiro will test H0:the data is normally distributed H1: the data is not normally…
Q: for a population with μ = 60 and σ = 8, the X value corresponding to z = 1.50 would…
A:
Q: w are graphical representations of two different samples, with the sample size indicated, from two…
A: The t-interval is used when the population standard deviation (σ ) is not known. In the construction…
Q: A teacher wants to compute for the body mass index of few students as part of his research. As a…
A: Since you have posted a question with multiple sub-parts, we will solve first three subparts for…
Q: The following is a list of 6 measurements. 15, 19, 7, 11, 17, 13 Send data to calculator Suppose…
A: The given data is 15, 19, 7, 11, 17, 13
Q: For a population with u=50 and o=10,what is the x value corresponding to z=0.4?
A: Given: Population mean = mu = 50 population standard deviation = sigma = 10 Z = 0.4
Q: 1. The average normal daily temperature ( in degree Celsius) and the corresponding average monthly…
A:
Q: 8. Given two estimators X1 and X2 for a population mean, E[X1] = 6, V[X1] = 4, and V[X2] = 5. If the…
A:
Q: 21. Given the following contingency table for Hair colour and Eye colour, find the value of x. Ís…
A:
Q: The following is a list of 6 measurements. 11, 17, 7, 8, 16, 20 Send data to calculator Suppose that…
A: Here we need to find the summation of the given data set.
Q: 4. From a data ,the following measures are obtained SSXY = 345, SSy = 363 and SSyy = 643. The…
A: In simple linear regression, there will be only one independent variable and one dependent variable.…
Q: **28. Consider the following: rxy = .85, Y = 40, Su = 6. Y' = 36. What is the range within which one…
A: c is the very much correct option that is 30-42
Q: For a group of 10 items EX = 452, EX²=24,270 and mode = 43.7. Find Pearson's coefficient of…
A: We have given that, Sample size (n) = 10 , Σ x = 452, Σ x^2= 24270 and mode = 43.7 Then, We will…
Q: The average normal daily temperature ( in degree Celsius) and the corresponding average monthly…
A:
Q: 4. For a sample of 12 observations, a businessman wants to regress the price (in dollar) of the…
A: Note: There is something wrong in the data, R2 should be less than 1, with this observation it s…

Step by step
Solved in 2 steps with 1 images

- The mean ±1 sd of ln [calcium intake (mg)] among 25females, 12 to 14 years of age, below the poverty level is6.56 ± 0.64. Similarly, the mean ± 1 sd of ln [calcium intake(mg)] among 40 females, 12 to 14 years of age, above thepoverty level is 6.80 ± 0.76.*8.7 Suppose an equal number of 12- to 14-year-old girlsbelow and above the poverty level are recruited to studydifferences in calcium intake. How many girls should berecruited to have an 80% chance of detecting a significantdifference using a two-sided test with α = .05?The mean ±1 sd of ln [calcium intake (mg)] among 25females, 12 to 14 years of age, below the poverty level is6.56 ± 0.64. Similarly, the mean ± 1 sd of ln [calcium intake(mg)] among 40 females, 12 to 14 years of age, above thepoverty level is 6.80 ± 0.76.8.6 Compute a 95% CI for the difference in meansbetween the two groups12/20 Compute the linear correlation coefficient between the weight of a car and its miles per gallon. R =_. Round to three decimal places as needed.
- For a population with u=50 and o=10,what is the x value corresponding to z=0.4?For a population of highly creative individuals with a creativity score µ = 60 and σ = 10, determine the percentage(s) associated with the particular z – score(s). What percentage of highly creative individuals have a creativity score below a z – score of + 1? What percentage of highly creative individuals have a creativity score below a z – score of + 2? What percentage of highly creative individuals have a creativity score below a z – score of + 1? What percentage of highly creative individuals have a creativity score below a z- score of – 1? What percentage of highly creative individuals have a creativity score below a z – score of – 2? What percentage of highly creative individuals have a creativity score above a z – score of – 2? What percentage of highly creative individuals have a creativity score above a z – score of – 1?For a population with µ = 40 and σ = 8, what is the X value corresponding to z = 1.50?
- The mean ±1 sd of ln [calcium intake (mg)] among 25females, 12 to 14 years of age, below the poverty level is6.56 ± 0.64. Similarly, the mean ± 1 sd of ln [calcium intake(mg)] among 40 females, 12 to 14 years of age, above thepoverty level is 6.80 ± 0.76 4-What is the p-value corresponding to your answer toProblem 8.4?for a population with μ = 60 and σ = 8, the X value corresponding to z = 1.50 would be........................................An SRS of 100 flights by Speedy Airlines showed that 64 were on time. An SRS of 100 flights by Happy Airlines showed that 80 were on time. Let pS be the proportion of on-time flights for all Speedy Airline flights, and let pH be the proportion of all on-time flights for all Happy Airlines flights. Is there evidence of a difference in the on-time rate for the two airlines? To determine this, you test the hypotheses H0 : pS – pH 0, Ha : pS – pH 0. The P-value of your test is 0.0117. Which of the following is an appropriate interpretation of the P-value? a. If the on-time rates for the two airlines are equal, there is a 0.0117 probability of getting samples with a difference as far or farther from zero as these samples. b. If the on-time rates for the two airlines are not equal, the probability of getting samples with a difference as far or farther from zero as these samples is 0.9883. c. The probability of making a Type I error is 0.0117. d. The probability of making a Type II error…
- 2.4. How many parameters must be estimated? 2.5. Give the fitted response function used to get the above output.Given that n=82 data points are collected when studying the relationship between average daily temperature and time spent watching television, use the critical values table below to determine if a calculated value of r=−0.974 is significant or not. df CV (+ and -) df CV (+ and -) df CV (+ and -) df CV (+ and -) 1 0.997 11 0.555 21 0.413 40 0.304 2 0.950 12 0.532 22 0.404 50 0.273 3 0.878 13 0.514 23 0.396 60 0.250 4 0.811 14 0.497 24 0.388 70 0.232 5 0.754 15 0.482 25 0.381 80 0.217 6 0.707 16 0.468 26 0.374 90 0.205 7 0.666 17 0.456 27 0.367 100 0.195 8 0.632 18 0.444 28 0.361 9 0.602 19 0.433 29 0.355 10 0.576 20 0.423 30 0.349 Select the correct answer below: r is significant because it is between the positive and negative critical values. r is not significant because it is between the positive and negative critical values. r is significant because it is not between the positive and negative critical values. r is not…Resistors labeled as 100 Ω are purchased from two different vendors. The specification for this type of resistor is that its actual resistance be within 5% of its labeled resistance. In a sample of 180 resistors from vendor A, 149 of them met the specification. In a sample of 270 resistors purchased from vendor B, 233 of them met the specification. Vendor A is the current supplier, but if the data demonstrate convincingly that a greater proportion of the resistors from vendor B meet the specification, a change will be made. P-value?


