9 9. 8 7 7 6 5 pH 4 3 3 2 1 40 35 30 25 20 15 10 5 0 5 10 15 20 25 30 35 40 added volumetmt) of 02 M HCI added volumetm of 0.2 M NaOH Figure 4. Combined plots from Figure 1 and Figure 2.
9 9. 8 7 7 6 5 pH 4 3 3 2 1 40 35 30 25 20 15 10 5 0 5 10 15 20 25 30 35 40 added volumetmt) of 02 M HCI added volumetm of 0.2 M NaOH Figure 4. Combined plots from Figure 1 and Figure 2.

Chemistry: Principles and Reactions
8th Edition
ISBN:9781305079373
Author:William L. Masterton, Cecile N. Hurley
Publisher:William L. Masterton, Cecile N. Hurley
Chapter14: Equilibria In Acid-base Solutions
Section: Chapter Questions
Problem 25QAP: A sodium hydrogen carbonate-sodium carbonate buffer is to be prepared with a pH of 9.40. (a) What...

Related questions
Question
100%
From the graphs in Figure 1, 2, 3, and 4, identify the buffer ranges
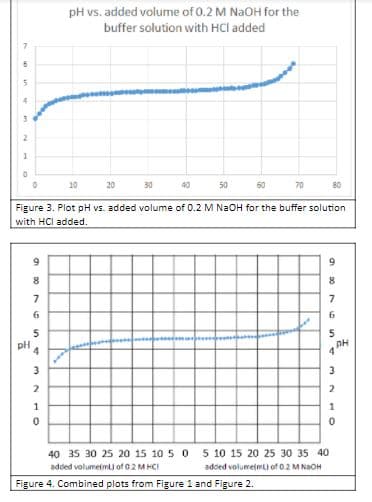
Transcribed Image Text:pH vs. added volume of 0.2 M NAOH for the
buffer solution with HCl added
10
20
30
40
50
60
70
B0
Figure 3. Plot pH vs. added volume of 0.2 M NAOH for the buffer solution
with HCl added.
9
8
7
6
5
pH
3
3
2
2
1
5 10 15 20 25 30 35 40
added volumetmu of 0.2 M NaOH
40 35 30 25 20 15 10 5 0
added volumetmt) of 02 MHCI
Figure 4. Combined plots from Figure 1 and Figure 2.
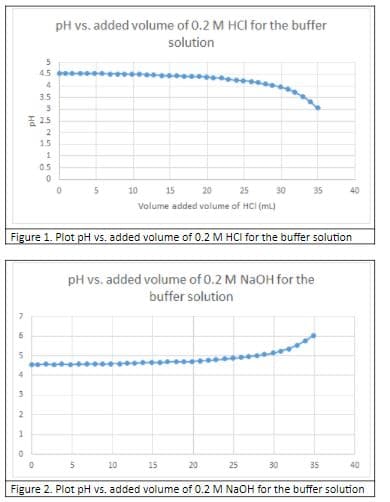
Transcribed Image Text:pH vs. added volume of 0.2 M HCI for the buffer
solution
45
4
3.5
2.5
1.5
05
10
15
20
25
30
35
40
Volume added volume of HCi (ml)
Figure 1. Plot pH vs. added volume of 0.2 M HCI for the buffer solution
pH vs. added volume of 0.2 M NaOH for the
buffer solution
10
15
20
25
30
35
40
Figure 2. Plot pH vs. added volume of 0.2 M NAOH for the buffer solution
Hd
Expert Solution
This question has been solved!
Explore an expertly crafted, step-by-step solution for a thorough understanding of key concepts.

Step by step
Solved in 2 steps

Knowledge Booster


Learn more about
Need a deep-dive on the concept behind this application? Look no further. Learn more about this topic, chemistry and related others by exploring similar questions and additional content below.Recommended textbooks for you
Chemistry: Principles and Reactions
Chemistry
ISBN:
9781305079373
Author:
William L. Masterton, Cecile N. Hurley
Publisher:
Cengage Learning

Principles of Modern Chemistry
Chemistry
ISBN:
9781305079113
Author:
David W. Oxtoby, H. Pat Gillis, Laurie J. Butler
Publisher:
Cengage Learning

Chemistry: Principles and Practice
Chemistry
ISBN:
9780534420123
Author:
Daniel L. Reger, Scott R. Goode, David W. Ball, Edward Mercer
Publisher:
Cengage Learning
Chemistry: Principles and Reactions
Chemistry
ISBN:
9781305079373
Author:
William L. Masterton, Cecile N. Hurley
Publisher:
Cengage Learning
Principles of Modern Chemistry
Chemistry
ISBN:
9781305079113
Author:
David W. Oxtoby, H. Pat Gillis, Laurie J. Butler
Publisher:
Cengage Learning
Chemistry: Principles and Practice
Chemistry
ISBN:
9780534420123
Author:
Daniel L. Reger, Scott R. Goode, David W. Ball, Edward Mercer
Publisher:
Cengage Learning

Chemical Principles in the Laboratory
Chemistry
ISBN:
9781305264434
Author:
Emil Slowinski, Wayne C. Wolsey, Robert Rossi
Publisher:
Brooks Cole


Chemistry & Chemical Reactivity
Chemistry
ISBN:
9781133949640
Author:
John C. Kotz, Paul M. Treichel, John Townsend, David Treichel
Publisher:
Cengage Learning