A manufacturer of colored candies states that 13% of the candies in a bag should be brown, 14% yellow, 13% red, 24% blue, 20% orange, and 16% green. A student randomly selected a bag of colored candies. He counted the number of candies of each color and obtained the results shown in the table. Test whether the bag of colored candies follows the distribution stated above at the a = 0.05 level of significance. E Click the icon to view the table. Color Frequency Expected Count Brown 61 52.65 Yellow 67 56.7 Red 55 52.65 Blue 59 97.2 Orange 99 81 Green 64 64.8 (Round to two decimal places as needed.) What is the test statistic? xổ - 0 (Round to three decimal places as needed.)
A manufacturer of colored candies states that 13% of the candies in a bag should be brown, 14% yellow, 13% red, 24% blue, 20% orange, and 16% green. A student randomly selected a bag of colored candies. He counted the number of candies of each color and obtained the results shown in the table. Test whether the bag of colored candies follows the distribution stated above at the a = 0.05 level of significance. E Click the icon to view the table. Color Frequency Expected Count Brown 61 52.65 Yellow 67 56.7 Red 55 52.65 Blue 59 97.2 Orange 99 81 Green 64 64.8 (Round to two decimal places as needed.) What is the test statistic? xổ - 0 (Round to three decimal places as needed.)

Glencoe Algebra 1, Student Edition, 9780079039897, 0079039898, 2018
18th Edition
ISBN:9780079039897
Author:Carter
Publisher:Carter
Chapter10: Statistics
Section10.4: Distributions Of Data
Problem 19PFA

Related questions
Topic Video
Question
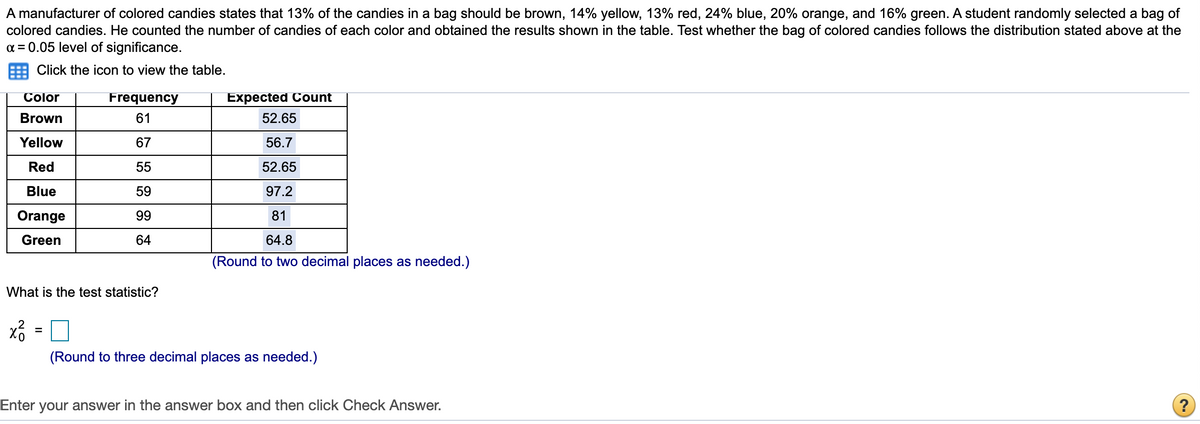
Transcribed Image Text:A manufacturer of colored candies states that 13% of the candies in a bag should be brown, 14% yellow, 13% red, 24% blue, 20% orange, and 16% green. A student randomly selected a bag of
colored candies. He counted the number of candies of each color and obtained the results shown in the table. Test whether the bag of colored candies follows the distribution stated above at the
a = 0.05 level of significance.
Click the icon to view the table.
Color
Frequency
Expected Count
Brown
61
52.65
Yellow
67
56.7
Red
55
52.65
Blue
59
97.2
Orange
99
81
Green
64
64.8
(Round to two decimal places as needed.)
What is the test statistic?
%3D
(Round to three decimal places as needed.)
Enter your answer in the answer box and then click Check Answer.
?
Expert Solution
This question has been solved!
Explore an expertly crafted, step-by-step solution for a thorough understanding of key concepts.

This is a popular solution!

Trending now
This is a popular solution!

Step by step
Solved in 2 steps with 1 images

Knowledge Booster


Learn more about
Need a deep-dive on the concept behind this application? Look no further. Learn more about this topic, statistics and related others by exploring similar questions and additional content below.Recommended textbooks for you
Glencoe Algebra 1, Student Edition, 9780079039897…
Algebra
ISBN:
9780079039897
Author:
Carter
Publisher:
McGraw Hill

College Algebra (MindTap Course List)
Algebra
ISBN:
9781305652231
Author:
R. David Gustafson, Jeff Hughes
Publisher:
Cengage Learning
Glencoe Algebra 1, Student Edition, 9780079039897…
Algebra
ISBN:
9780079039897
Author:
Carter
Publisher:
McGraw Hill
College Algebra (MindTap Course List)
Algebra
ISBN:
9781305652231
Author:
R. David Gustafson, Jeff Hughes
Publisher:
Cengage Learning