A manufacturer of colored candies states that 13% of the candies in a bag should be brown, 14% yellow, 13% red, 24% blue, 20% orange, and 16% green. A student randomly selected a bag of colored candies. He counted the number of candies of each color and obtained the results shown in the table. Test whether the bag of colored candies follows the distribution stated above at the a = 0.05 level of significance. E Click the icon to view the table. Red 57 51.35 94.80 79.00 63.20 (Round to two decimal places as needed.) Blue 61 Orange 88 Green 66 What is the test statistic? * = 16.33 (Round to three decimal places as needed.) What is the P-value of the test? P-value = (Round to three decimal places as needed.)
A manufacturer of colored candies states that 13% of the candies in a bag should be brown, 14% yellow, 13% red, 24% blue, 20% orange, and 16% green. A student randomly selected a bag of colored candies. He counted the number of candies of each color and obtained the results shown in the table. Test whether the bag of colored candies follows the distribution stated above at the a = 0.05 level of significance. E Click the icon to view the table. Red 57 51.35 94.80 79.00 63.20 (Round to two decimal places as needed.) Blue 61 Orange 88 Green 66 What is the test statistic? * = 16.33 (Round to three decimal places as needed.) What is the P-value of the test? P-value = (Round to three decimal places as needed.)

College Algebra (MindTap Course List)
12th Edition
ISBN:9781305652231
Author:R. David Gustafson, Jeff Hughes
Publisher:R. David Gustafson, Jeff Hughes
Chapter8: Sequences, Series, And Probability
Section8.7: Probability
Problem 6E: List the sample space of each experiment. Tossing three coins

Related questions
Topic Video
Question
Transcribed Image Text:Heip
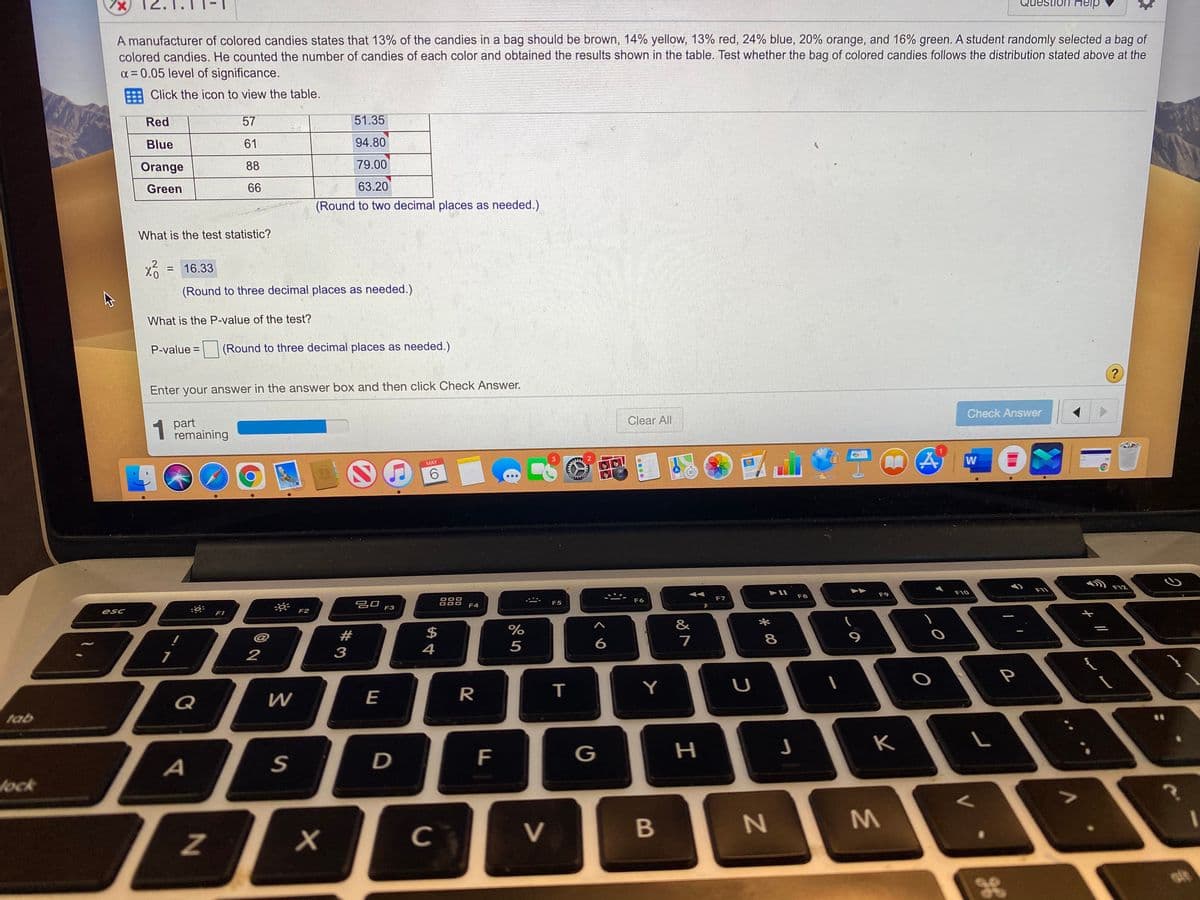
A manufacturer of colored candies states that 13% of the candies in a bag should be brown, 14% yellow, 13% red, 24% blue, 20% orange, and 16% green. A student randomly selected a bag of
colored candies. He counted the number of candies of each color and obtained the results shown in the table. Test whether the bag of colored candies follows the distribution stated above at the
a = 0.05 level of significance.
Click the icon to view the table.
Red
57
51.35
Blue
61
94.80
Orange
88
79.00
Green
66
63.20
(Round to two decimal places as needed.)
What is the test statistic?
= 16.33
(Round to three decimal places as needed.)
What is the P-value of the test?
P-value =(Round to three decimal places as needed.)
Enter your answer in the answer box and then click Check Answer.
Check Answer
1 part
remaining
Clear All
W
MAY
6.
F12
F11
F10
F8
F9
F7
吕88
F6
吕口
F4
F5
F3
esc
F1
&
#
$
%
5
6.
7
8
3
4
1
P
Y
E
R
Q
tab
K
D
F
G
lock
M.
х
V
36
Expert Solution
This question has been solved!
Explore an expertly crafted, step-by-step solution for a thorough understanding of key concepts.

Step by step
Solved in 2 steps

Knowledge Booster


Learn more about
Need a deep-dive on the concept behind this application? Look no further. Learn more about this topic, statistics and related others by exploring similar questions and additional content below.Recommended textbooks for you
College Algebra (MindTap Course List)
Algebra
ISBN:
9781305652231
Author:
R. David Gustafson, Jeff Hughes
Publisher:
Cengage Learning
College Algebra (MindTap Course List)
Algebra
ISBN:
9781305652231
Author:
R. David Gustafson, Jeff Hughes
Publisher:
Cengage Learning