As a result of the 20% rent increase, the number of vacant units demanded units. Adjust the previous graph to show the effect of the increase in earnings. The increase in earnings results in a new equilibrium rent of s | per month and a new equilibrium number of vacancies of |units. Now suppose that the state of California introduces rent control by setting the maximum rent at $2,400 per month. On the previous graph, use the grev point (star symbol) to indicate the number of vacancies demanded. Then use the tan point (dash svmbol) to
As a result of the 20% rent increase, the number of vacant units demanded units. Adjust the previous graph to show the effect of the increase in earnings. The increase in earnings results in a new equilibrium rent of s | per month and a new equilibrium number of vacancies of |units. Now suppose that the state of California introduces rent control by setting the maximum rent at $2,400 per month. On the previous graph, use the grev point (star symbol) to indicate the number of vacancies demanded. Then use the tan point (dash svmbol) to

Economics: Private and Public Choice (MindTap Course List)
16th Edition
ISBN:9781305506725
Author:James D. Gwartney, Richard L. Stroup, Russell S. Sobel, David A. Macpherson
Publisher:James D. Gwartney, Richard L. Stroup, Russell S. Sobel, David A. Macpherson
Chapter4: Demand And Supply: Applications And Extensions
Section: Chapter Questions
Problem 2CQ

Related questions
Question
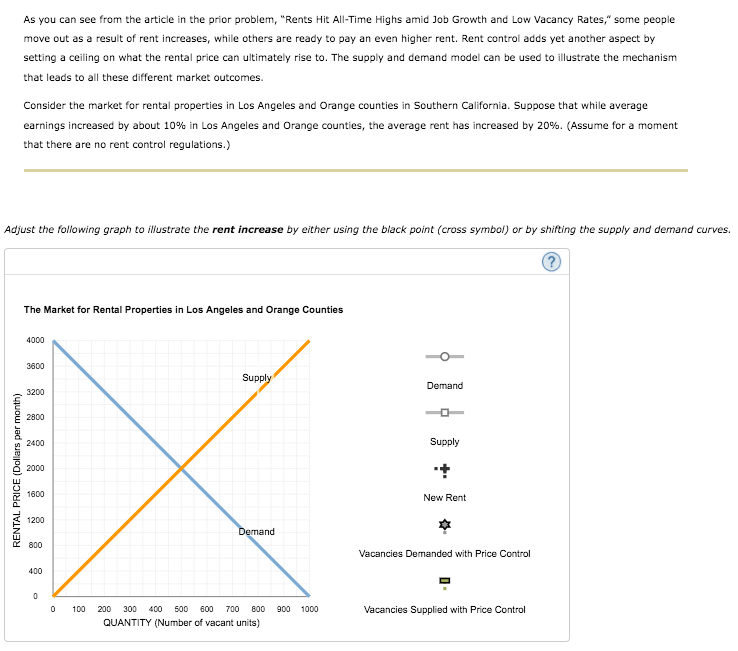
Transcribed Image Text:As you can see from the article in the prior problem, "Rents Hit All-Time Highs amid Job Growth and Low Vacancy Rates," some people
move out as a result of rent increases, while others are ready to pay an even higher rent. Rent control adds yet another aspect by
setting a ceiling on what the rental price can ultimately rise to. The supply and demand model can be used to illustrate the mechanism
that leads to all these different market outcomes.
Consider the market for rental properties in Los Angeles and Orange counties in Southern California. Suppose that while average
earnings increased by about 10% in Los Angeles and Orange counties, the average rent has increased by 20%. (Assume for a moment
that there are no rent control regulations.)
Adjust the following graph to illustrate the rent increase by either using the black point (cross symbol) or by shifting the supply and demand curves.
The Market for Rental Properties in Los Angeles and Orange Counties
4000
3600
Supply
Demand
3200
2800
2400
Supply
2000
1600
New Rent
1200
Demand
800
Vacancies Demanded with Price Control
400
100
200
300 400
500
600
700
800
900 1000
Vacancies Supplied with Price Control
QUANTITY (Number of vacant units)
RENTAL PRICE (Dollars per month)
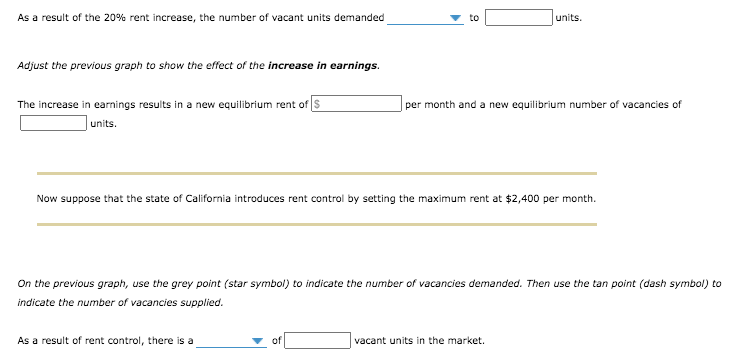
Transcribed Image Text:As a result of the 20% rent increase, the number of vacant units demanded
to
units.
Adjust the previous graph to show the effect of the increase in earnings.
The increase in earnings results in a new equilibrium rent of S
per month and a new equilibrium number of vacancies of
units.
Now suppose that the state of California introduces rent control by setting the maximum rent at $2,400 per month.
On the previous graph, use the grey point (star symbol) to indicate the number of vacancies demanded. Then use the tan point (dash symbol) to
indicate the number of vacancies supplied.
As a result of rent control, there is a
vacant units in the market.
Expert Solution
This question has been solved!
Explore an expertly crafted, step-by-step solution for a thorough understanding of key concepts.

This is a popular solution!

Trending now
This is a popular solution!

Step by step
Solved in 2 steps with 1 images

Recommended textbooks for you
Economics: Private and Public Choice (MindTap Cou…
Economics
ISBN:
9781305506725
Author:
James D. Gwartney, Richard L. Stroup, Russell S. Sobel, David A. Macpherson
Publisher:
Cengage Learning

Microeconomics: Private and Public Choice (MindTa…
Economics
ISBN:
9781305506893
Author:
James D. Gwartney, Richard L. Stroup, Russell S. Sobel, David A. Macpherson
Publisher:
Cengage Learning

Macroeconomics: Private and Public Choice (MindTa…
Economics
ISBN:
9781305506756
Author:
James D. Gwartney, Richard L. Stroup, Russell S. Sobel, David A. Macpherson
Publisher:
Cengage Learning
Economics: Private and Public Choice (MindTap Cou…
Economics
ISBN:
9781305506725
Author:
James D. Gwartney, Richard L. Stroup, Russell S. Sobel, David A. Macpherson
Publisher:
Cengage Learning
Microeconomics: Private and Public Choice (MindTa…
Economics
ISBN:
9781305506893
Author:
James D. Gwartney, Richard L. Stroup, Russell S. Sobel, David A. Macpherson
Publisher:
Cengage Learning
Macroeconomics: Private and Public Choice (MindTa…
Economics
ISBN:
9781305506756
Author:
James D. Gwartney, Richard L. Stroup, Russell S. Sobel, David A. Macpherson
Publisher:
Cengage Learning

Principles of Macroeconomics (MindTap Course List)
Economics
ISBN:
9781305971509
Author:
N. Gregory Mankiw
Publisher:
Cengage Learning

Principles of Economics 2e
Economics
ISBN:
9781947172364
Author:
Steven A. Greenlaw; David Shapiro
Publisher:
OpenStax

Macroeconomics: Principles and Policy (MindTap Co…
Economics
ISBN:
9781305280601
Author:
William J. Baumol, Alan S. Blinder
Publisher:
Cengage Learning