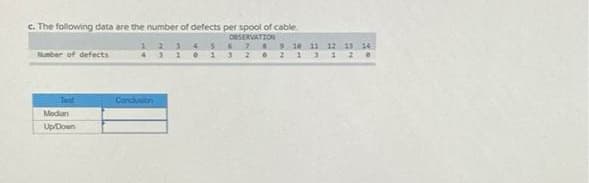
C. The following data are the number of defects per spool of cable ORSERVATION E2E9 3 11 12 13 14 23 Nuber of defects 3 1 2 Conduon Modian UpDoen %3B


Q: A study at the physics laboratory at Istanbul Kültür University is made to examine the defects in an…
A: Chi square test for independence: Chi square test is used to test whether the two categorical…
Q: Shoe size, r 8.5 9.0 9.0 9.5 10.0 10.0 10.5 Height, y 66.0 68.5 67.5 70.0 70.0 72.0 71.5 Shoe size,…
A: we will find the regression equation in excel by entering data points and then find slope using…
Q: Given the following information 10 10 10 Ex, = 178, Ev, = 187, Ty = 16300, N = 1000, E(v,-rx;)² =…
A:
Q: From the following data compute quartile devia- tion and the Coefficient of Skewness. Size : 5-7…
A:
Q: Is it possible to get the following from a set of experimental data: (a) r23 = 0.8, r13 = - 0.5, r12…
A:
Q: (no subject) - gustaviafrankling x i…
A: Given that To find the distance between the two poles to the nearest foot is
Q: In what sense is the mean teh center of distributon? a.M is the center because half the sample…
A: The mean is is the centre of the distribution because mean is based on all the observation. The sum…
Q: 1. The stack plot below shows cookie sales at a shop over a 6 week period before a holida Holiday…
A: From the above graph, In week 3 almond cookies sale is >5, Gingerbread cookies sale is >15 And…
Q: i. 1 person/0.08 mi2 ii. 100 people/0.8 mi2 iii. 12500 people/12.5 mi2 iv. 1 person/0.008 mi2 v.
A: Given that population densities are equivalent to a density of 125
Q: Use the information in the table below to answer the question. In = 15 SSXY = 285.2 beta0_hat = 36…
A: Given, n = 15 β^0 = 36β^1 = 12.4SSxy = 285.2SSxx = 23S = 7 To find, What is the prediction…
Q: A random sample of n, 10 regions in New England gave the following violent crime rates (per milion…
A: Given: n1 = 10 n2 = 12 Formula Used: Mean X = ∑Xin Sample standard deviation S = ∑Xi-X2n-1…
Q: 1. Using the above data we obtain the following descriptive statistics Deaths PCRTests Admissions…
A: As per guidelines, we will only answer first three subparts. a) Daily mean deaths in the UK over…
Q: Given that a die is tossed and has the following data: x 1 2 3 4 5 6 Choose... P(x) 1/6 k1/61/61/6…
A:
Q: Based on the information below, which pair is not statistically different? xbar_A = 251.6 n_A = 5…
A: The Studentized range (Q) distribution is used to compare the significant difference between…
Q: The following data refers to yield of tomatoes (kg/plot) for four different levels of salinity.…
A: Solution
Q: An internet company operates three indistinguishable transmitting stations at different areas.…
A: Given problem Given that An internet company operates three indistinguishable transmitting…
Q: 1 Evaluate 士V16 目 ?/1 (Level 2) Show Your Work
A:
Q: 31 Use Simpson's Rule and all the data in the following table to estimate the value of the integral…
A: Here we have to use Simpson's Rule and estimate the value of the integral ∫2531ydx=? Given:- x 25…
Q: Consider the model yy= A + y for i= 1,..t and j=1,.. Given the follow th trt 3. 6. 4. 36.4 21.6 18.3…
A:
Q: (k) Last month, the TSE Index's monthly rate of return was 1.5%. This is, at the end of last month…
A: TSERofReturn Xi AcmeRofReturn Yi Predicted AcmeRofReturn Y^i Yi-Y^i2 0.42478 -0.48194 0.187993493…
Q: Given the following data: -1 1 2 y -1 1 Predict the value of y(1.5) using natural cubic spline…
A: Cubic spline formula is fi(x)=xi-x36hMi-1+x-xi-136hMi+xi-xhyi-1-h26Mi-1+x-xi-1hyi-h26Mi........(1)…
Q: A. Compute the z for each given the following: 1. Claimed proportion = 0.2, Sample proportion =…
A: “Since you have posted a question with multiple sub-parts, we will solve the first three subparts…
Q: Xdbar = (O S = D D O \130 D 120/ S-1 = (0 D O ? D ? \30 Q (p)? Sample Size (n)? Subgroup (m)?…
A: Solution
Q: The following data were obtained with a cascade impactor: D, (um) G (%) 0.5 5.4 1.0 14.4 23.4 37.0…
A: Develop the plot of “Cumulative % less than the top size vs. top value in the size range or Dp” on…
Q: 2. For a population with u = 40 and o = 5, compute the z-score corresponding to each of the…
A: Given data,μ=40σ=5
Q: Let Yi, Yz, YG, le rndom. fa Cale) Sample from distriba tion with Pod f where a determine Unknown…
A: ConsiderY1,Y2,Y3 as a random sample from a distribution. The probability distribution function is…
Q: Given that SST= 270, R2 = 0.75 and n = 40, then the model error variance is %3D Oa. 2.776 O b. 1.677…
A: Given, SST=270R2=0.75n=40 Error variance formula: S2=SSEn-2
Q: Given the following set of discrete data: 1.3 1.4 1.5 1.6 1.7 1.8 y(x) 1.418 1.713 2.027 2.358 2.707…
A:
Q: The following data refers to yield of tomatoes (kg/plot) for four different levels of salinity.…
A:
Q: A. Compute the z for each given the following 1. Claimed proportion = 0.2, Sample proportion = 0.18,…
A: Given that Q3) claimed proportion=0.66; p=0.66 sample proportion=0.61;p^=0.61 Sample size =40; n=40…
Q: 1. Classify each of the following regions as Type I, Type II, both, or neither. (b) (c) (d) y=(x+ 1…
A: We need to classify the type of region for given curves.
Q: pp. 986-990), researchers reported on a study of the effects of r draw in a magnetic core by…
A:
Q: 4. Calculate SStotal, SSpetween» and SSwithin for the following set of data: Treatment 1 Treatment 2…
A:
Q: A study of the relationship between age and various visual functions (such as acuity and depth…
A: Solution-: From the given data we want to calculate (a) ∑xi=? ∑xi2=? (b) sample variance s2=?…
Q: Verify the following statistical identities: a) E (T; – T)² = E1 x} – nữ² b) E1(C; – T)(y: – 9) =…
A: Since you have posted a question with multiple sub-parts, we will solve first three sub-parts for…
Q: Calculate C.I, Sample Skewness and Sample Kurtosis from the following grouped data: Class 10-20…
A: Given that Class and frequency of group data is given we have to find sample skewness, kurtosis and…
Q: For this grouped data set: Scores | Frequencies 30-34 | 7 25-29 |…
A:
Q: rofessional baseball players gave the following information. lable that represents the percentage of…
A: "Since you have posted a question with multiple sub-parts, we will solve first three sub-parts for…
Q: llustration 11.11. Compute quartile doviation and coefficient of skewness from the following values.…
A:
Q: 31 Use Simpson's Rule and all the data in the following table to estimate the value of the integral…
A: Solve by suing Simpsons rule
Q: The following data represent the length of life in years, measured to the nearest tenth, of 30…
A: To compute skewness and kurtosis using excel we have, Kurtosis = KURT (number1, number2…) Thus, the…
Q: For a population with u = 50 and o = 10, a score of X - 55corresponds to z = +0.50. %3D O True O…
A: Consider that the mean and standard deviation of a random variable X are µ and σ, respectively.…
Q: Base your answer to the following questions on the Punnett square, which shows a cross between two…
A:
Q: 18. In two towns A and B, the following information was supplied by an investigator: Town A 240 40…
A: Introduction - Degree of association is measured as coefficient of correlation Coefficient of…
Q: The distribution of number of stores according to size in 3 areas is given in the following table:…
A: Since you have posted a question with multiple sub-parts, we will solve first three subparts for…
Q: From the Gaussian error curve, what is the probäbility From population lies between +o and +20 ?…
A:
Q: The following data were obtained in an experiment to investigate whether compressive strength of…
A: capping material batch value 1 1 1847 1 2 1942 1 3 1935 1 4 1891 1 5 1795 2 1 1779 2 2…
Q: Each AA battery in a sample of 2500 batteries is checked for its voltage. If the voltages are…
A:
Q: Material is analyzed for weight in grams from three vendors-A, B, C- by three different inspectors…
A: Given:
Q: 8. Consider the following measures of the segments shown in the diagram. BF =12 cm CF = 6 cm 6. DF =…
A:
Please provide Handwritten answer

Step by step
Solved in 2 steps with 1 images

- The following measurements are recorded as propagation delay of a certain transmission tower located at Manila and a receiver located at Cebu. 15.378 17.625 18.013 18.419 19.020 19.041 30.001 Name any outliers from the data.The following data pertain to x, the amount of fertil-izer (in pounds) that a farmer applies to his soil, and y, his yield of wheat (in bushels per acre): xy xy xy112 33 88 24 37 2792 28 44 17 23 972 38 132 36 77 3266 17 23 14 142 38112 35 57 25 37 1388 31 111 40 127 2342 8 69 29 88 31126 37 19 12 48 3772 32 103 27 61 2552 20 141 40 71 1428 17 77 26 113 26 Assuming that the data can be looked upon as a randomsample from a bivariate normal population, calculate rand test its significance at the 0.01 level of significance.Also, draw a scattergram of these paired data and judgewhether the assumption seems reasonable.You obtained the following raw data when setting up a Biuret standard curve: BSA (mg/ml) Absorbancy 540nm 0 0.158 1 0.210 2 0.260 3 0.305 4 0.360 5 0.410 6 0.455 7 0.510 8 0.530 9 0.550 10 0.554 What would the quality of the line-fit (R2 value) be if you do not exclude experimental outliers? (Give you answer to 4 decimal places)
- Given following data set generate dot plot number of text messages sent by 20 students in Mrs. T calculus class 1 3 2 13 32 8 2 6 3 4 1 0 2 2 0 2 1 2 7 2Consider the following data relating hours spent studying (X) and average grade on course quizzes (Y): X Y 5 6 3 8 4 8 7 10 5 7 6 9 Compute: ExEy/n 1140 6 240 235The average normal daily temperature ( in degree Celsius) and the corresponding average monthly precipitation( in inches ) for the month of June are shown below for seven randomly selected cities. Compute for the value of r, complete the table with the needed information. Temperature(x) 30 27 28 32 27 23 18 Precipitation(y) 3.4 1.8 3.5 3.6 3.7 1.5 0.2
- The data given is shown below 40 40 43 46 44 49 51 54 46 51 47 49 49 45 45 44 45 41 49 52 51 54 50 51 41 52 53 50 46 56 42 42 40 42 49 47 51 48 46 57 48 55 49 46 57 44 49 43 44 43 51 48 48 46 49 Class width = 6 Find the following: A. Decile (5th) B. Quartile (2nd) C. Skewness D. KurtosisFor this grouped data set: Scores | Frequencies 30-34 | 7 25-29 | 9 20-24 | 14 15-19 | 10 10-14 | 8 5-9 | 2 What is the Skewness and Kurtosis of the data set?The following table contains data on the temperature and the pressureof a gas in a cylinder. What is the pressure of the gas at T = 520 and T = 750degrees Kelvin? Hint: fit the least square line to this.Temp. (◦K) 483 659 703 643 407 605 640 479 409 783Pres. (atm) 1.84 2.37 2.85 2.52 1.55 2.15 2.35 1.86 1.66 3.16
- Kaitlyn measures the upload speed in megabits per second of her home broadband internet connection during peak hours and off-peak hours. The results are provided in the accompanying table. Peak Off-Peak 5.83 5.14 6.05 6.80 7.14 6.98 3.54 5.77 5.45 7.27 5.90 6.62 5.81 6.19 4.82 6.08 6.37 6.59 4.65 5.58 5.30 7.41 6.48 6.26 5.96 6.37 5.79 6.31 6.84 6.55 5.06 4.95 5.61 7.03 6.45 6.77 Examine the results of Kaitlyn's test to determine the statements that compare the medians and interquartile ranges of the data sets to each other in terms of this situation. Select the two correct answers. The median upload speed during peak hours is 5.905 megabits per second, which is less than the median upload speed during off-peak hours, 7.005 megabits per second. The upload speeds during peak hours are slower on average compared to off-peak times. The median upload speed during peak hours is 6.37 megabits per second, which is greater than the median upload speed during…Determine the following: a) Mode b) Median c) MAD d) Standard Dev. Lower Boundary Freq 4.1 3 4.6 10 5.1 15 5.6 8 6.1 3 6.6 1 7.1 15 7.6 10 ΣGiven that n=82 data points are collected when studying the relationship between average daily temperature and time spent watching television, use the critical values table below to determine if a calculated value of r=−0.974 is significant or not. df CV (+ and -) df CV (+ and -) df CV (+ and -) df CV (+ and -) 1 0.997 11 0.555 21 0.413 40 0.304 2 0.950 12 0.532 22 0.404 50 0.273 3 0.878 13 0.514 23 0.396 60 0.250 4 0.811 14 0.497 24 0.388 70 0.232 5 0.754 15 0.482 25 0.381 80 0.217 6 0.707 16 0.468 26 0.374 90 0.205 7 0.666 17 0.456 27 0.367 100 0.195 8 0.632 18 0.444 28 0.361 9 0.602 19 0.433 29 0.355 10 0.576 20 0.423 30 0.349 Select the correct answer below: r is significant because it is between the positive and negative critical values. r is not significant because it is between the positive and negative critical values. r is significant because it is not between the positive and negative critical values. r is not…


