
ENGR.ECONOMIC ANALYSIS
14th Edition
ISBN: 9780190931919
Author: NEWNAN
Publisher: Oxford University Press
expand_more
expand_more
format_list_bulleted
Related questions
Question
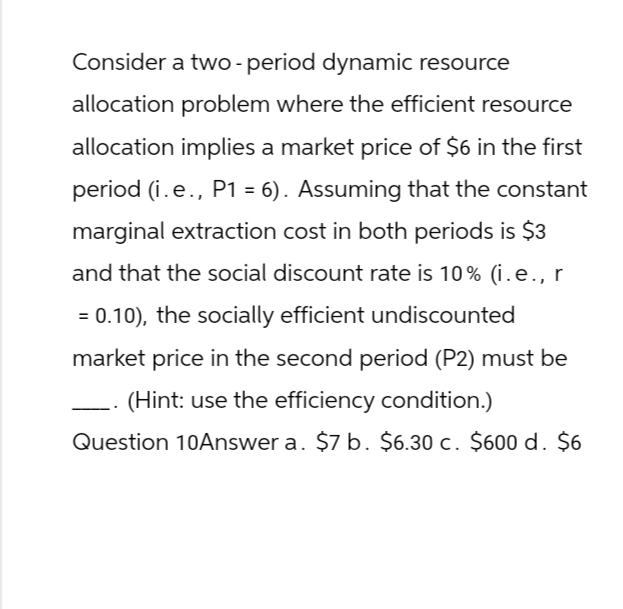

Transcribed Image Text:Consider a two- period dynamic resource
allocation problem where the efficient resource
allocation implies a market price of $6 in the first
period (i. e., P1 = 6). Assuming that the constant
marginal extraction cost in both periods is $3
and that the social discount rate is 10% (i.e., r
= 0.10), the socially efficient undiscounted
market price in the second period (P2) must be
(Hint: use the efficiency condition.)
Question 10Answer a. $7 b. $6.30 c. $600 d. $6
Expert Solution
This question has been solved!
Explore an expertly crafted, step-by-step solution for a thorough understanding of key concepts.

This is a popular solution

Trending nowThis is a popular solution!

Step by stepSolved in 3 steps

Knowledge Booster


Learn more about
Need a deep-dive on the concept behind this application? Look no further. Learn more about this topic, economics and related others by exploring similar questions and additional content below.Similar questions
- Consider the following two-period model of dynamically efficient extraction of a non-renewable natural resource. The constant social marginal cost of extraction is 40 in each period and the total stock of the resource is Q = 300 units. Moreover, the social marginal benefit is MB(Qt) = 200 Qt, where Qt is the quantity of resource extracted in period t, for t = 0; 1. The discount factor is 0:8. What is the marginal user cost (or scarcity rent) of the resource in each period?arrow_forwardAssume the relationship between the growth of a fish population and the population size can be represented as g= 8S – 0.2S2, where g is the growth in tons and S is the size of the population (in thousands of tons) a. Given a price of $100 a ton of fish, what is the marginal benefit of smaller population sizes?arrow_forwardCompare two versions of the two-period depletable resource model that differ only in the treatment of marginal extraction cost. Assume that in the second version the constant marginal extraction cost is lower in the second period than the first (perhaps due to the anticipated arrival of a new, superior extraction technology). The constant marginal extraction cost is the same in both periods in the first version and is equal to the marginal extraction cost in the first period of the second version. In a dynamic efficient allocation, how would the extraction profile in the second version differ from the first? Would relatively more or less be allocated to the second period in the second version than in the first version? Would the marginal user cost be higher or lower in the second version? Why?Carrow_forward
- Please label the graph point where the socially optimal equilibrium isarrow_forwardYou manage two chocolate factories. Using only these two factories, you must produce exactly 420 kgs of chocolate daily at lowest possible cost. Mathematically, you have: Q1 = Quantity produced at Chocolate Factory #1 Q2 = Quantity produced at Chocolate Factory #2 Daily total overall production: Q1 – Q2 = 420 At present, each factory produces half the overall requirement. This means that Q1 = 210, Q2 = 210 a) Following your logic , you realize that as long as the marginal cost is different between the two factories, you can lower overall cost while maintaining production at 420 kgs. So, to reduce the overall cost to the lowest possible, you decide to move more than 1 kilogram from one factory to another. As a result, each factory will produce a different quantity of chocolate while the overall daily production remains at 420 kgs. To minimize overall cost, how many kilograms will you order/instruct Factory #1 to produce? Q1 = ____________kgs And how many kilograms would you…arrow_forwardThe biological relationship between the growth for the fish population and the size of the fish population is g = 12S(1 - S/4) where g is the growth of the fish population and S is the size of the population. The size of the harvest is a function of the amount of human effort expended b = 3ES where E is the level of effort. Market price of fish per unit is $100 and a constant marginal cost of effort is $40. We can derive the free-access equilibrium effort level Ef by setting the net benefits function equal to zero. Then, E f = in one decimal place. Hint: Write the numberarrow_forward
arrow_back_ios
arrow_forward_ios
Recommended textbooks for you
 Principles of Economics (12th Edition)EconomicsISBN:9780134078779Author:Karl E. Case, Ray C. Fair, Sharon E. OsterPublisher:PEARSON
 Engineering Economy (17th Edition)EconomicsISBN:9780134870069Author:William G. Sullivan, Elin M. Wicks, C. Patrick KoellingPublisher:PEARSON
 Principles of Economics (MindTap Course List)EconomicsISBN:9781305585126Author:N. Gregory MankiwPublisher:Cengage Learning
 Managerial Economics: A Problem Solving ApproachEconomicsISBN:9781337106665Author:Luke M. Froeb, Brian T. McCann, Michael R. Ward, Mike ShorPublisher:Cengage Learning
 Managerial Economics & Business Strategy (Mcgraw-...EconomicsISBN:9781259290619Author:Michael Baye, Jeff PrincePublisher:McGraw-Hill Education
Principles of Economics (12th Edition)
Economics
ISBN:9780134078779
Author:Karl E. Case, Ray C. Fair, Sharon E. Oster
Publisher:PEARSON
Engineering Economy (17th Edition)
Economics
ISBN:9780134870069
Author:William G. Sullivan, Elin M. Wicks, C. Patrick Koelling
Publisher:PEARSON
Principles of Economics (MindTap Course List)
Economics
ISBN:9781305585126
Author:N. Gregory Mankiw
Publisher:Cengage Learning
Managerial Economics: A Problem Solving Approach
Economics
ISBN:9781337106665
Author:Luke M. Froeb, Brian T. McCann, Michael R. Ward, Mike Shor
Publisher:Cengage Learning
Managerial Economics & Business Strategy (Mcgraw-...
Economics
ISBN:9781259290619
Author:Michael Baye, Jeff Prince
Publisher:McGraw-Hill Education