Consider the excel output attached and answer the following... A) Us the t-statistic approach to test for linear relationship between Y and X at 5% significance level. Identify the test statistic in the regression output and show how it is calculated. Hypothesis: Null Hypothesis: H0: ___ 0 (no linear relationship exists) Alternative Hypothesis: HA: B1 ≠ 0 (linear relationship exists)- Two tail Test-statistic: Level of Significance: _______________________________ Critical value of test statistic: _______________________________ Decision Rule: Decision: Conclusion: B) Use is p-value approach to test of the existence of a linear relationship between a Y and X at 5% significance level (use the regression table values rather than calculations). Hypothesis: Null Hypothesis: H0: ___________________________________ Alternative Hypothesis: HA: _____________________________________ p-value = Decision Rule: Decision: Conclusion:
Consider the excel output attached and answer the following... A) Us the t-statistic approach to test for linear relationship between Y and X at 5% significance level. Identify the test statistic in the regression output and show how it is calculated. Hypothesis: Null Hypothesis: H0: ___ 0 (no linear relationship exists) Alternative Hypothesis: HA: B1 ≠ 0 (linear relationship exists)- Two tail Test-statistic: Level of Significance: _______________________________ Critical value of test statistic: _______________________________ Decision Rule: Decision: Conclusion: B) Use is p-value approach to test of the existence of a linear relationship between a Y and X at 5% significance level (use the regression table values rather than calculations). Hypothesis: Null Hypothesis: H0: ___________________________________ Alternative Hypothesis: HA: _____________________________________ p-value = Decision Rule: Decision: Conclusion:

Algebra & Trigonometry with Analytic Geometry
13th Edition
ISBN:9781133382119
Author:Swokowski
Publisher:Swokowski
Chapter5: Inverse, Exponential, And Logarithmic Functions
Section5.6: Exponential And Logarithmic Equations
Problem 67E

Related questions
Question
Consider the excel output attached and answer the following...
A)
- Us the t-statistic approach to test for linear relationship between Y and X at 5% significance level. Identify the test statistic in the regression output and show how it is calculated.
Hypothesis:
Null Hypothesis: H0: ___ 0 (no linear relationship exists)
Alternative Hypothesis: HA: B1 ≠ 0 (linear relationship exists)- Two tail
Test-statistic:
Level of Significance: _______________________________
Critical value of test statistic: _______________________________
Decision Rule:
Decision:
Conclusion:
B)
- Use is p-value approach to test of the existence of a linear relationship between a Y and X at 5% significance level (use the regression table values rather than calculations).
Hypothesis:
Null Hypothesis: H0: ___________________________________
Alternative Hypothesis: HA: _____________________________________
p-value =
Decision Rule:
Decision:
Conclusion:
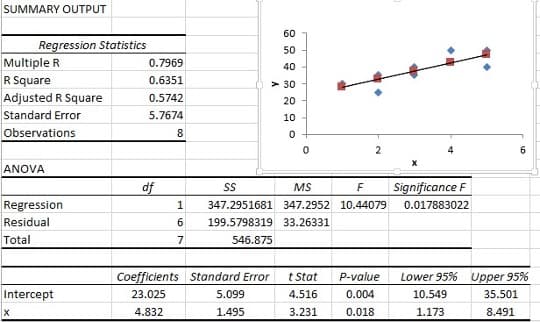
Transcribed Image Text:SUMMARY OUTPUT
60
Regression Statistics
Multiple R
R Square
50
0.7969
40
0.6351
> 30
Adjusted R Square
0.5742
20
Standard Error
5.7674
10
Observations
8
6.
ANOVA
df
MS
Significance F
Regression
Residual
1
347.2951681 347.2952 10.44079
0.017883022
6
199.5798319 33.26331
Total
7
546.875
Coefficients Standard Error
t Stat
P-value
Lower 95% Upper 95%
Intercept
23.025
5.099
4.516
0.004
10.549
35.501
4.832
1.495
3.231
0.018
1.173
8.491
Expert Solution
This question has been solved!
Explore an expertly crafted, step-by-step solution for a thorough understanding of key concepts.

Step by step
Solved in 2 steps with 2 images

Recommended textbooks for you
Algebra & Trigonometry with Analytic Geometry
Algebra
ISBN:
9781133382119
Author:
Swokowski
Publisher:
Cengage

Glencoe Algebra 1, Student Edition, 9780079039897…
Algebra
ISBN:
9780079039897
Author:
Carter
Publisher:
McGraw Hill

Linear Algebra: A Modern Introduction
Algebra
ISBN:
9781285463247
Author:
David Poole
Publisher:
Cengage Learning
Algebra & Trigonometry with Analytic Geometry
Algebra
ISBN:
9781133382119
Author:
Swokowski
Publisher:
Cengage
Glencoe Algebra 1, Student Edition, 9780079039897…
Algebra
ISBN:
9780079039897
Author:
Carter
Publisher:
McGraw Hill
Linear Algebra: A Modern Introduction
Algebra
ISBN:
9781285463247
Author:
David Poole
Publisher:
Cengage Learning