Consumer Reports uses a survey of readers to obtain customer satisfaction ratings for the nation's largest supermarkets (Consumer Reports website). Each survey respondent is asked to rate a specified supermarket based on a variety of factors such as quality of products, selection, value, checkout efficiency, service, and store layoL An overall satisfaction score summarizes the rating for each respondent with 100 meaning the respondent is complețely satisfied in terms of all factors. Sample data representative of independent samples of Publix and Trader Joe's customers are shown below. Excel File: data10-07.xlsx Publix Trader Joe's n = 250 n2 = 300 E = 86 E2 = 85 a. Formulate the null and alternative hypotheses to test whether there is a difference between the population mean customer satisfaction scores for the two retailers. Ho : H1 - H2 Select your answer H : H1 - H2 Select your answer - b. Assume that experience with the Consumer Reports satisfaction rating scale indicates that a population standard deviation of 12 is a reasonable assumption for both retailers. Conduct the hypothesis test and report the p-value. p-value = (to 3 decimals) At a 0.05 level of significance what is your conclusion? I. Reject Ho. There is not sufficient evidence to conclude that the mean satisfaction scores differ for the two retailers. II. Do not reject Ho. There is not sufficient evidence to conclude that the mean satisfaction scores differ for the two retailers. III. Reject Ho. There is sufficient evidence to conclude that the mean satisfaction scores differ for the two retailers. IV. Do not reject Ho. There is sufficient evidence to conclude that the mean satisfaction scores differ for the two retailers. Select your answer c. Which retailer, if either, appears to have the greater customer satisfaction? Select your answer
Consumer Reports uses a survey of readers to obtain customer satisfaction ratings for the nation's largest supermarkets (Consumer Reports website). Each survey respondent is asked to rate a specified supermarket based on a variety of factors such as quality of products, selection, value, checkout efficiency, service, and store layoL An overall satisfaction score summarizes the rating for each respondent with 100 meaning the respondent is complețely satisfied in terms of all factors. Sample data representative of independent samples of Publix and Trader Joe's customers are shown below. Excel File: data10-07.xlsx Publix Trader Joe's n = 250 n2 = 300 E = 86 E2 = 85 a. Formulate the null and alternative hypotheses to test whether there is a difference between the population mean customer satisfaction scores for the two retailers. Ho : H1 - H2 Select your answer H : H1 - H2 Select your answer - b. Assume that experience with the Consumer Reports satisfaction rating scale indicates that a population standard deviation of 12 is a reasonable assumption for both retailers. Conduct the hypothesis test and report the p-value. p-value = (to 3 decimals) At a 0.05 level of significance what is your conclusion? I. Reject Ho. There is not sufficient evidence to conclude that the mean satisfaction scores differ for the two retailers. II. Do not reject Ho. There is not sufficient evidence to conclude that the mean satisfaction scores differ for the two retailers. III. Reject Ho. There is sufficient evidence to conclude that the mean satisfaction scores differ for the two retailers. IV. Do not reject Ho. There is sufficient evidence to conclude that the mean satisfaction scores differ for the two retailers. Select your answer c. Which retailer, if either, appears to have the greater customer satisfaction? Select your answer

Glencoe Algebra 1, Student Edition, 9780079039897, 0079039898, 2018
18th Edition
ISBN:9780079039897
Author:Carter
Publisher:Carter
Chapter10: Statistics
Section10.6: Summarizing Categorical Data
Problem 10CYU

Related questions

Question
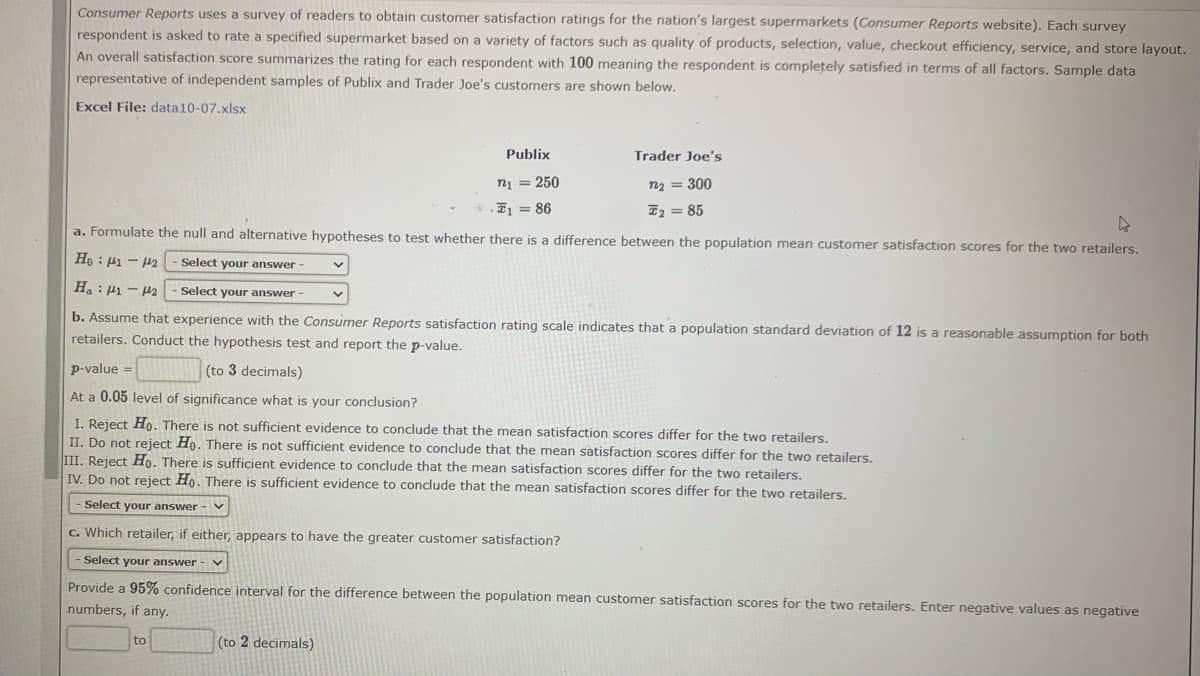
Transcribed Image Text:Consumer Reports uses a survey of readers to obtain customer satisfaction ratings for the nation's largest supermarkets (Consumer Reports website). Each survey
respondent is asked to rate a specified supermarket based on a variety of factors such as quality of products, selection, value, checkout efficiency, service, and store layout.
An overall satisfaction score summarizes the rating for each respondent with 100 meaning the respondent is completely satisfied in terms of all factors. Sample data
representative of independent samples of Publix and Trader Joe's customers are shown below.
Excel File: data10-07.xlsx
Publix
Trader Joe's
n1 = 250
n2 = 300
E = 86
I2 = 85
a. Formulate the null and alternative hypotheses to test whether there is a difference between the population mean customer satisfaction scores for the two retailers.
Select your answer -
Ha: P1 - H2
Select your answer-
b. Assume that experience with the Consumer Reports satisfaction rating scale indicates that a population standard deviation of 12 is a reasonable assumption for both
retailers. Conduct the hypothesis test and report the p-value.
p-value =
(to 3 decimals)
At a 0.05 level of significance what is your conclusion?
I. Reject Ho. There is not sufficient evidence to conclude that the mean satisfaction scores differ for the two retailers.
II. Do not reject Ho. There is not sufficient evidence to conclude that the mean satisfaction scores differ for the two retailers.
III. Reject Ho. There is sufficient evidence to conclude that the mean satisfaction scores differ for the two retailers.
IV. Do not reject Ho. There is sufficient evidence to conclude that the mean satisfaction scores differ for the two retailers.
- Select your answer - v
c. Which retailer, if either, appears to have the greater customer satisfaction?
Select your answer
Provide a 95% confidence interval for the difference between the population mean customer satisfaction scores for the two retailers. Enter negative values as negative
numbers, if any.
to
(to 2 decimals)
Expert Solution
This question has been solved!
Explore an expertly crafted, step-by-step solution for a thorough understanding of key concepts.

This is a popular solution!

Trending now
This is a popular solution!

Step by step
Solved in 2 steps with 2 images

Knowledge Booster


Learn more about
Need a deep-dive on the concept behind this application? Look no further. Learn more about this topic, statistics and related others by exploring similar questions and additional content below.Recommended textbooks for you
Glencoe Algebra 1, Student Edition, 9780079039897…
Algebra
ISBN:
9780079039897
Author:
Carter
Publisher:
McGraw Hill

Holt Mcdougal Larson Pre-algebra: Student Edition…
Algebra
ISBN:
9780547587776
Author:
HOLT MCDOUGAL
Publisher:
HOLT MCDOUGAL

College Algebra (MindTap Course List)
Algebra
ISBN:
9781305652231
Author:
R. David Gustafson, Jeff Hughes
Publisher:
Cengage Learning
Glencoe Algebra 1, Student Edition, 9780079039897…
Algebra
ISBN:
9780079039897
Author:
Carter
Publisher:
McGraw Hill
Holt Mcdougal Larson Pre-algebra: Student Edition…
Algebra
ISBN:
9780547587776
Author:
HOLT MCDOUGAL
Publisher:
HOLT MCDOUGAL
College Algebra (MindTap Course List)
Algebra
ISBN:
9781305652231
Author:
R. David Gustafson, Jeff Hughes
Publisher:
Cengage Learning
