
Advanced Engineering Mathematics
10th Edition
ISBN: 9780470458365
Author: Erwin Kreyszig
Publisher: Wiley, John & Sons, Incorporated
expand_more
expand_more
format_list_bulleted
Related questions
Question
Create an Excel spreadsheet that includes the given table and
then create a scatter plot , which correctly displays the values
from this table. The study times should be the explanatory
variable on the x-axis and the exam scores are the response
variable on the y-axis. Your spreadsheet should include each
of the following items:
- Your Name
- The given table, including the column titles
- A descriptive and easily readable chart title
- Descriptive and easy to read titles for both the x and y-axis
- A line-of-best fit with the equation of this line also included
- Answers to each of the questions below
1. What is the value of the correlation coefficient , r ?
2. What type of correlation best describes the relationship
between study time and exam score?
a. Strong, Negative Linear association
b. Weak, Negative Linear association
c. Strong, Positive Linear association
d. Weak, Positive Linear association
3. By interpreting the slope of the trendline (line-of-best fit),
what observation can you make about the effect that 1 hour
of additional weekly study time has on exam score?
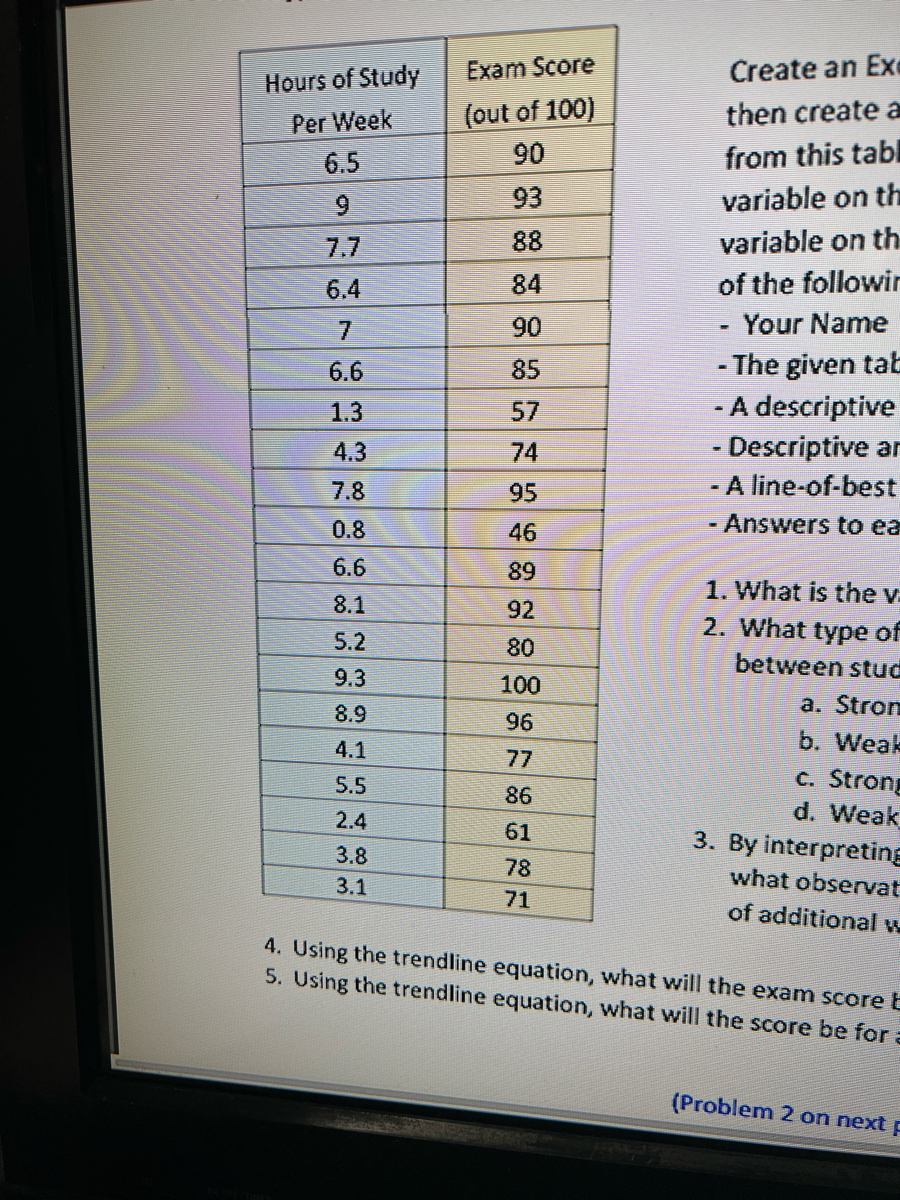

Transcribed Image Text:Hours of Study
Per Week
6.5
9
6.4
7
6.6
1.3
4.3
7.8
0.8
6.6
8.1
5.2
9.3
8.9
4.1
5.5
2.4
3.8
3.1
Exam Score
(out of 100)
90
93
88
84
90
85
57
74
95
46
89
92
80
100
96
77
86
61
78
71
Create an Exe
then create a
from this tabl
variable on th
variable on th
of the followir
Your Name
-The given tab
- A descriptive
- Descriptive ar
-
-A line-of-best
Answers to ea
1. What is the v
2. What type of
between stud
a. Strom
b. Weak
c. Strong
d. Weak
3. By interpreting
what observat
of additional w
4. Using the trendline equation, what will the exam score E
5. Using the trendline equation, what will the score be for a
(Problem 2 on next p
Expert Solution
This question has been solved!
Explore an expertly crafted, step-by-step solution for a thorough understanding of key concepts.

This is a popular solution

Trending nowThis is a popular solution!

Step by stepSolved in 3 steps with 3 images

Knowledge Booster

Similar questions
- Identify the type of data that would be used when the variable of interest is most-watched TV show.arrow_forwardWhat is ranked data?arrow_forwardUsing the line of best fit, which equation most closely represents the set of data? { (-5, 8.2), (-3, 14.5), (0, 23.1), (2, 29.7), (6, 40.2), (10, 53.8), (13, 64.4) }arrow_forward
- The data were collected from a statistics class. The column head gives the variable, and each of the rows represents a student in the class. Find the frequency, proportion, and percentage of right-handed people. LOADING... Click the icon to view the data table. Question content area bottom Part 1 The frequency of right-handed people in the class is enter your response here . (Type a whole number.) Part 2 The proportion of right-handed people in the class is enter your response here . (Type an integer or a fraction.) Part 3 The percentage of right-handed people in the class is enter your response here %. (Type an integer or decimal rounded to one decimal place as needed.)arrow_forwardList the most important data types. &tell Two example for Eacharrow_forwardBriefly explain the procedure you may adopt to summarize data set obtained from field study.arrow_forward
- Data: 3.5, 3.2, 3.1, 3.5, 3.6, 3.2, 3.4, 2.9, 4.1, 2.6, 3.3, 3.5, 3.9, 3.8, 3.7, 3.4, 3.6, 3.5, 3.5, 3.7, 3.6, 3.8, 3.2, 3.4, 4.2, 3.6, 3.1, 2.9, 2.5, 3.5, 3.1, 3.2, 3.7, 3.8, 3.4, 3.6, 3.5, 3.2, 3.6, 3.8 Sketch a histogram with ranges of 0.1, from minimum (2.5) to maximum (4.2) values. Then sketch a histogram with ranges of 0.3. You can include the relative frequency scales on the same sketches.arrow_forwardHow do you read this stem-and-leaf plot?arrow_forwardA back-to-back stem-and-leaf plot compares two data sets by using the same stems for each data set. Leaves for the first data set are on one side while leaves for the second data set are on the other side. The back-to-back stem- and-leaf plot available below shows the salaries (in thousands) of all lawyers at two small law firms. Complete parts (a) and (b) below. Click the icon to view the back-to-back stem-and-leaf plot. (a) What are the lowest and highest salaries at Law Firm A? at Law Firm B? How many lawyers are in each firm? At Law Firm A the lowest salary was $ At Law Firm B the lowest salary was $ and the highest salary was $ and the highest salary was $arrow_forward
- Continue monitoring the process. A second ten days of data have been collected, see table labeled “2nd 10 Days of Monitoring Reservation Processing Time” in the Data File. Develop Xbar and R charts for the 2nd 10 days of monitoring. Plot the data for the 2nd 10 days on the Xbar and R charts. Is the reservation process for the 2nd 10 days of monitoring in control? If the control chart indicates an out-of-control process, note which days, the pattern, and whether it is the Xbar or R chart. Based on the X-bar and R Charts that you developed for the 2nd 10 days of data, is the process in control? Group of answer choices No. The X-bar and R Charts are both out of control. No. The X-bar Chart is in control, but the R Chart is out of control. No. The R Chart is in control, but the X-bar Chart is out of control. Yes. The X-bar and R Charts are both in control.arrow_forwardplease provide CORRECT answers! Thank you.arrow_forward
arrow_back_ios
arrow_forward_ios
Recommended textbooks for you
- Advanced Engineering MathematicsAdvanced MathISBN:9780470458365Author:Erwin KreyszigPublisher:Wiley, John & Sons, Incorporated
 Numerical Methods for EngineersAdvanced MathISBN:9780073397924Author:Steven C. Chapra Dr., Raymond P. CanalePublisher:McGraw-Hill Education
 Introductory Mathematics for Engineering Applicat...Advanced MathISBN:9781118141809Author:Nathan KlingbeilPublisher:WILEY
  Mathematics For Machine TechnologyAdvanced MathISBN:9781337798310Author:Peterson, John.Publisher:Cengage Learning,

Advanced Engineering Mathematics
Advanced Math
ISBN:9780470458365
Author:Erwin Kreyszig
Publisher:Wiley, John & Sons, Incorporated
Numerical Methods for Engineers
Advanced Math
ISBN:9780073397924
Author:Steven C. Chapra Dr., Raymond P. Canale
Publisher:McGraw-Hill Education
Introductory Mathematics for Engineering Applicat...
Advanced Math
ISBN:9781118141809
Author:Nathan Klingbeil
Publisher:WILEY
Mathematics For Machine Technology
Advanced Math
ISBN:9781337798310
Author:Peterson, John.
Publisher:Cengage Learning,