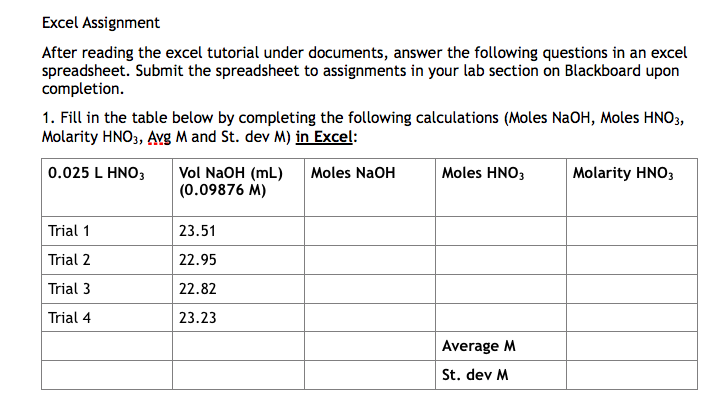
Excel Assignment After reading the excel tutorial under documents, answer the following questions in an excel spreadsheet. Submit the spreadsheet to assignments in your lab section on Blackboard upon completion. 1. Fill in the table below by completing the following calculations (Moles NaOH, Moles HNO3, Molarity HNO3, AYg M and St. dev M) in Excel: 0.025 L HNO, Vol NaOH (mL) (0.09876 M) Moles NaOH Moles HNO, Molarity HNO, Trial 1 23.51 Trial 2 22.95 Trial 3 22.82 Trial 4 23.23 Average M St. dev M
Excel Assignment After reading the excel tutorial under documents, answer the following questions in an excel spreadsheet. Submit the spreadsheet to assignments in your lab section on Blackboard upon completion. 1. Fill in the table below by completing the following calculations (Moles NaOH, Moles HNO3, Molarity HNO3, AYg M and St. dev M) in Excel: 0.025 L HNO, Vol NaOH (mL) (0.09876 M) Moles NaOH Moles HNO, Molarity HNO, Trial 1 23.51 Trial 2 22.95 Trial 3 22.82 Trial 4 23.23 Average M St. dev M

Introductory Chemistry: A Foundation
9th Edition
ISBN:9781337399425
Author:Steven S. Zumdahl, Donald J. DeCoste
Publisher:Steven S. Zumdahl, Donald J. DeCoste
Chapter9: Chemical Quantities
Section: Chapter Questions
Problem 62QAP: An air bag is deployed by utilizing the following re tion the nitrogen gas produced inflates the air...

Related questions
Question
100%
Please help
Transcribed Image Text:Excel Assignment
After reading the excel tutorial under documents, answer the following questions in an excel
spreadsheet. Submit the spreadsheet to assignments in your lab section on Blackboard upon
completion.
1. Fill in the table below by completing the following calculations (Moles NaOH, Moles HNO3,
Molarity HNO3, AYg M and St. dev M) in Excel:
0.025 L HNO;
Vol NaOH (mL)
(0.09876 M)
Moles NaOH
Moles HNO3
Molarity HNO3
Trial 1
23.51
Trial 2
22.95
Trial 3
22.82
Trial 4
23.23
Average M
St. dev M
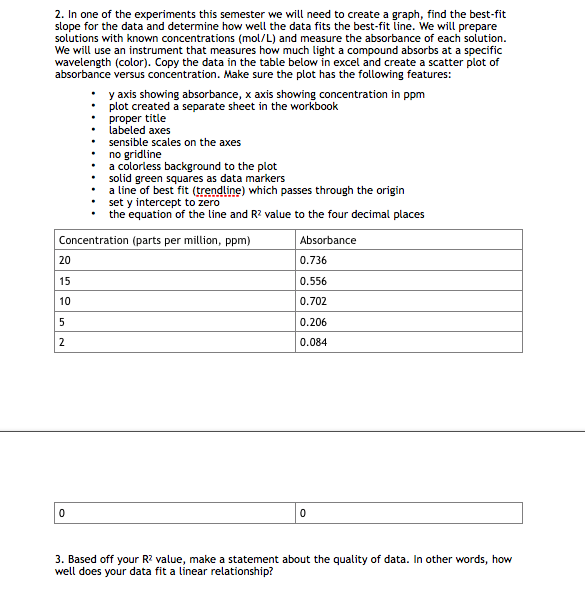
Transcribed Image Text:2. In one of the experiments this semester we will need to create a graph, find the best-fit
slope for the data and determine how well the data fits the best-fit line. We will prepare
solutions with known concentrations (mol/L) and measure the absorbance of each solution.
We will use an instrument that measures how much light a compound absorbs at a specific
wavelength (color). Copy the data in the table below in excel and create a scatter plot of
absorbance versus concentration. Make sure the plot has the following features:
y axis showing absorbance, x axis showing concentration in ppm
plot created a separate sheet in the workbook
proper títle
labeled axes
sensible scales on the axes
no gridline
a colorless background to the plot
solid green squares as data markers
a line of best fit (trendline) which passes through the origin
set y intercept to zero
the equation of the line and R? value to the four decimal places
Concentration (parts per million, ppm)
Absorbance
20
0.736
15
0.556
10
0.702
0.206
2
0.084
3. Based off your R? value, make a statement about the quality of data. In other words, how
well does your data fit a linear relationship?
Expert Solution
This question has been solved!
Explore an expertly crafted, step-by-step solution for a thorough understanding of key concepts.

This is a popular solution!

Trending now
This is a popular solution!

Step by step
Solved in 7 steps

Recommended textbooks for you
Introductory Chemistry: A Foundation
Chemistry
ISBN:
9781337399425
Author:
Steven S. Zumdahl, Donald J. DeCoste
Publisher:
Cengage Learning

Chemistry: Matter and Change
Chemistry
ISBN:
9780078746376
Author:
Dinah Zike, Laurel Dingrando, Nicholas Hainen, Cheryl Wistrom
Publisher:
Glencoe/McGraw-Hill School Pub Co
Introductory Chemistry: A Foundation
Chemistry
ISBN:
9781337399425
Author:
Steven S. Zumdahl, Donald J. DeCoste
Publisher:
Cengage Learning
Chemistry: Matter and Change
Chemistry
ISBN:
9780078746376
Author:
Dinah Zike, Laurel Dingrando, Nicholas Hainen, Cheryl Wistrom
Publisher:
Glencoe/McGraw-Hill School Pub Co

Chemistry for Engineering Students
Chemistry
ISBN:
9781285199023
Author:
Lawrence S. Brown, Tom Holme
Publisher:
Cengage Learning

Chemistry: An Atoms First Approach
Chemistry
ISBN:
9781305079243
Author:
Steven S. Zumdahl, Susan A. Zumdahl
Publisher:
Cengage Learning

Chemistry
Chemistry
ISBN:
9781305957404
Author:
Steven S. Zumdahl, Susan A. Zumdahl, Donald J. DeCoste
Publisher:
Cengage Learning