
Advanced Engineering Mathematics
10th Edition
ISBN: 9780470458365
Author: Erwin Kreyszig
Publisher: Wiley, John & Sons, Incorporated
expand_more
expand_more
format_list_bulleted
Related questions
Question
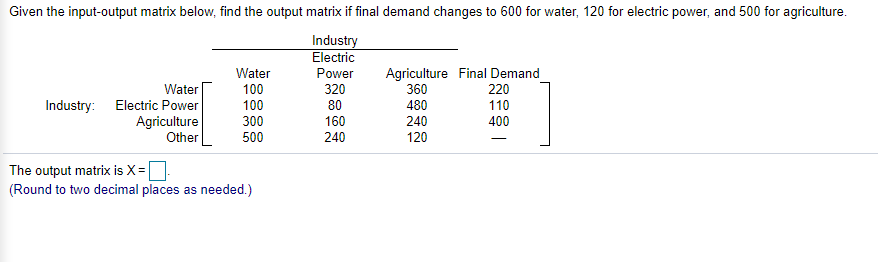

Transcribed Image Text:Given the input-output matrix below, find the output matrix if final demand changes to 600 for water, 120 for electric power, and 500 for agriculture.
Industry
Electric
Agriculture Final Demand
360
480
240
120
Power
320
Water
220
110
Water
100
Industry: Electric Power
Agriculture
Other
100
80
160
240
300
400
500
The output matrix is X =
(Round to two decimal places as needed.)
Expert Solution
This question has been solved!
Explore an expertly crafted, step-by-step solution for a thorough understanding of key concepts.

Step by stepSolved in 2 steps with 1 images

Knowledge Booster


Learn more about
Need a deep-dive on the concept behind this application? Look no further. Learn more about this topic, advanced-math and related others by exploring similar questions and additional content below.Similar questions
- Government funding: The following table presents the budget (in millions of dollars) for selected organizations that received U.S. government funding for arts and culture in both 2004 and 2006. Use a TI-84 calculator to answer the following. Organization 2004 2006 Smithsonian Institution 489 517 Corporation for Public Broadcasting 377 460 Institute of Museum and Library Services 262 247 Commission of Fine Arts 8 2 Advisory Council on Historic Preservation 4 5 Source: National Endowment for the Arts If two institutions have budgets that differ by 15 million dollars in 2004, by how much would you predict their budgets to differ in 2006? Round the answer to three decimal places.arrow_forwardA company manufactures a product at its plants in A, B, and C, then ships the product to six customers in G, H, J, K, and L, The monthly capacity of plants A, B, and Care 7400, 7300, and 10000 units, respectively. The monthly demand from customers G, H, J, K, and Lare 3000, 500, 4600, 7500, and 8900 units, respectively. Use Excel Solver to find the optimal distribution plant that will give the lowest total monthly shipping cost if the shipping cost per unit (in dollars per unit) are as follows: - from A to G, H, J, K, and L are 4, 9, 20, 6, and 13 dollars per unit, respectively; from B to G, H, J, K, and L are 12, 7, 3, 10, and 6 dollars per unit, respectively; from C to G, H, J, K, and L are 7, 6, 12, 2, and 9 dollars per unit, respectively. - The optimal total shipping costs is dollars per month.arrow_forward
Recommended textbooks for you
- Advanced Engineering MathematicsAdvanced MathISBN:9780470458365Author:Erwin KreyszigPublisher:Wiley, John & Sons, Incorporated
 Numerical Methods for EngineersAdvanced MathISBN:9780073397924Author:Steven C. Chapra Dr., Raymond P. CanalePublisher:McGraw-Hill Education
 Introductory Mathematics for Engineering Applicat...Advanced MathISBN:9781118141809Author:Nathan KlingbeilPublisher:WILEY
  Mathematics For Machine TechnologyAdvanced MathISBN:9781337798310Author:Peterson, John.Publisher:Cengage Learning,

Advanced Engineering Mathematics
Advanced Math
ISBN:9780470458365
Author:Erwin Kreyszig
Publisher:Wiley, John & Sons, Incorporated
Numerical Methods for Engineers
Advanced Math
ISBN:9780073397924
Author:Steven C. Chapra Dr., Raymond P. Canale
Publisher:McGraw-Hill Education
Introductory Mathematics for Engineering Applicat...
Advanced Math
ISBN:9781118141809
Author:Nathan Klingbeil
Publisher:WILEY
Mathematics For Machine Technology
Advanced Math
ISBN:9781337798310
Author:Peterson, John.
Publisher:Cengage Learning,