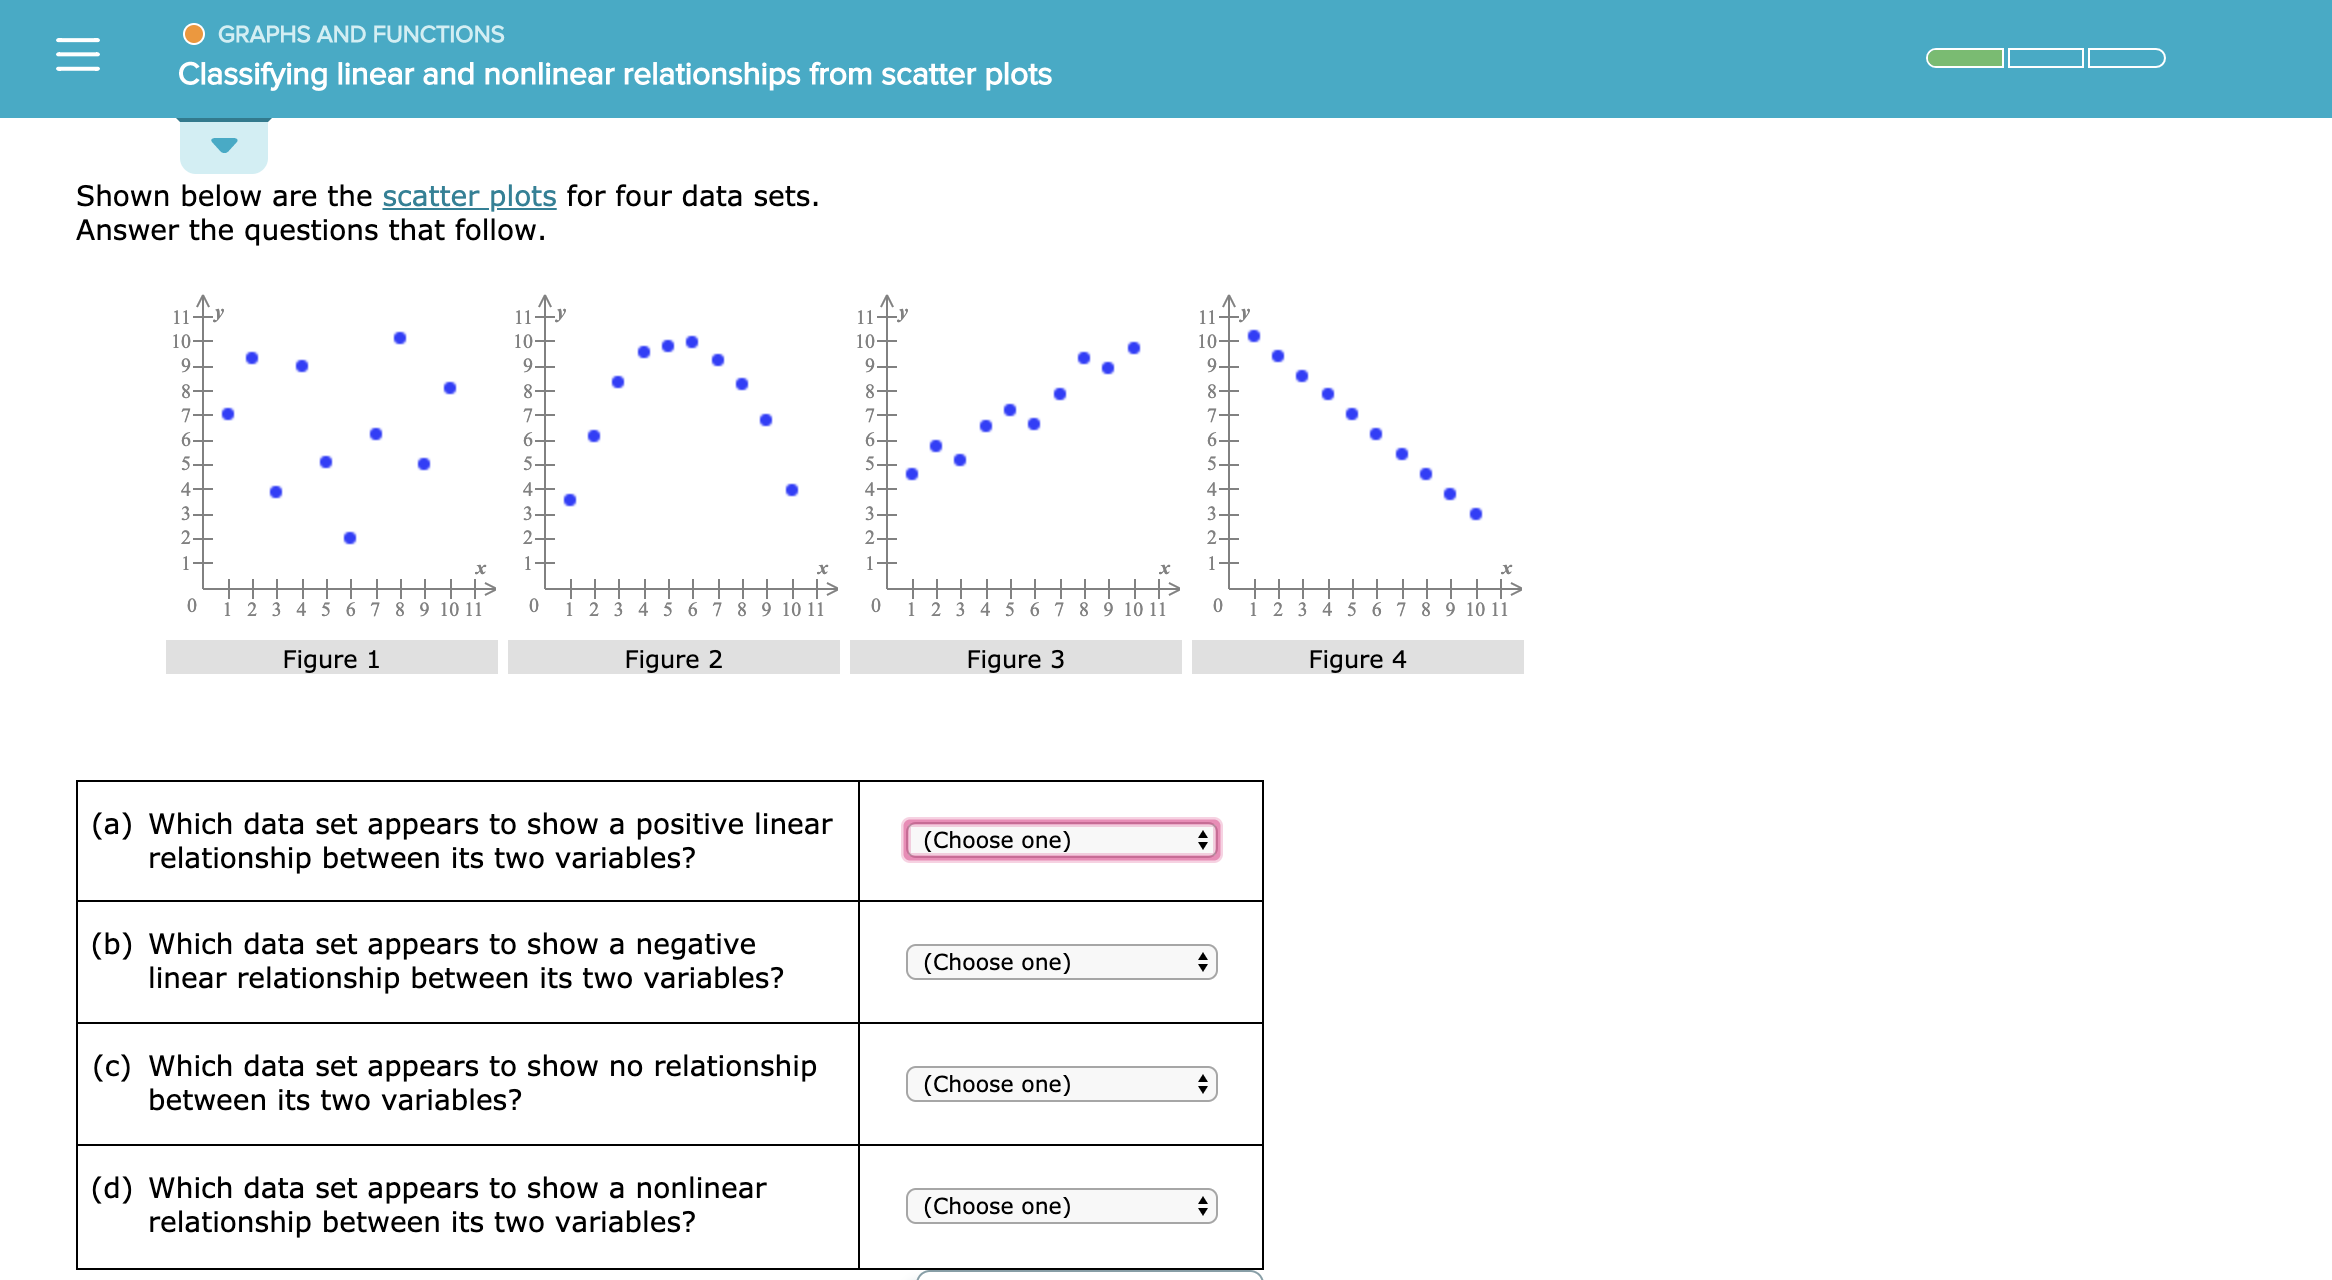
GRAPHS AND FUNCTIONS Classifying linear and nonlinear relationships from scatter plots Shown below are the scatter plots for four data sets. Answer the questions that follow 11 11 11 11 10+ 10+ 10- 9 7 7 7 6- 6- 5 4 4 4 4 3 3 3 3 2 2 2 2 1 1 1 0 10 0 10 34 5 6 7 8 9 10 11 1 2 3 1 2 3 4 5 6 7 89 10 11 1 2 3 4 5 6 789 10 11 1 4 5 6 7 8 9 10 11 Figure 1 Figure 3 Figure 2 Figure 4 (a) Which data set appears to show a relationship between its two variables? positive linear (Choose one) (b) Which data set appears to show a negative linear relationship between its two variables? (Choose one) (c) Which data set appears to show no relationship between its two variables? (Choose one) (d) Which data set appears to show a nonlinear relationship between its two variables? (Choose one)


Angles in Circles
Angles within a circle are feasible to create with the help of different properties of the circle such as radii, tangents, and chords. The radius is the distance from the center of the circle to the circumference of the circle. A tangent is a line made perpendicular to the radius through its endpoint placed on the circle as well as the line drawn at right angles to a tangent across the point of contact when the circle passes through the center of the circle. The chord is a line segment with its endpoints on the circle. A secant line or secant is the infinite extension of the chord.
Arcs in Circles
A circular arc is the arc of a circle formed by two distinct points. It is a section or segment of the circumference of a circle. A straight line passing through the center connecting the two distinct ends of the arc is termed a semi-circular arc.
See attachment


Trending now
This is a popular solution!

Step by step
Solved in 4 steps


