Histograms of random sample data are often used as an indication of the shape of the underlying population distribution. The histograms on below are based on random samples of size 30, 50, and 100 from the same population. (a). Complete the table giving the range of the sample data in each of the histograms. (refer to picture of table) (b). Based on the completed table, select the most reasonable estimate of the range of the population data. A. 10 to 15 B. 9 to 14 C. 9 to 15 D. 11 to 13


Histograms of random sample data are often used as an indication of the shape of the underlying population distribution. The histograms on below are based on random samples of size 30, 50, and 100 from the same population.
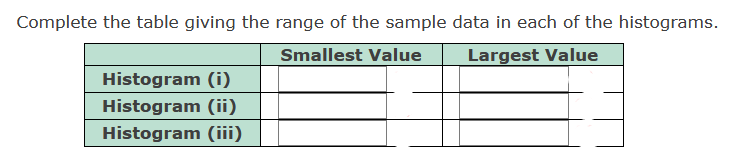
(a). Complete the table giving the
(b). Based on the completed table, select the most reasonable estimate of the range of the population data.
A. 10 to 15
B. 9 to 14
C. 9 to 15
D. 11 to 13
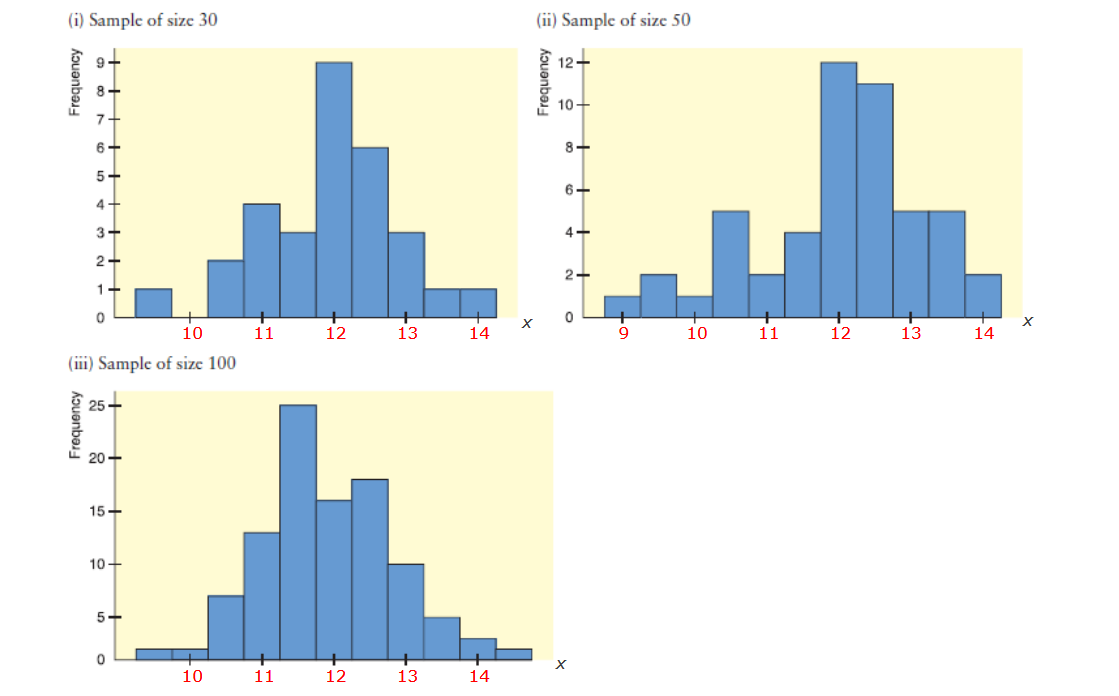
(a). Given, histogram based on the random sample of sizes 30,50 and 100 from the same population.
From the given histogram, the required range of the sample data in each histograms are obtained as-
| Smallest value | Largest value | |
| Histogram (i) | 9.5 | 14 |
| Histogram (ii) | 9 | 14 |
| Histogram (iii) | 9.5 | 14.5 |

Trending now
This is a popular solution!

Step by step
Solved in 2 steps


