
MATLAB: An Introduction with Applications
6th Edition
ISBN: 9781119256830
Author: Amos Gilat
Publisher: John Wiley & Sons Inc
expand_more
expand_more
format_list_bulleted
Related questions
Question
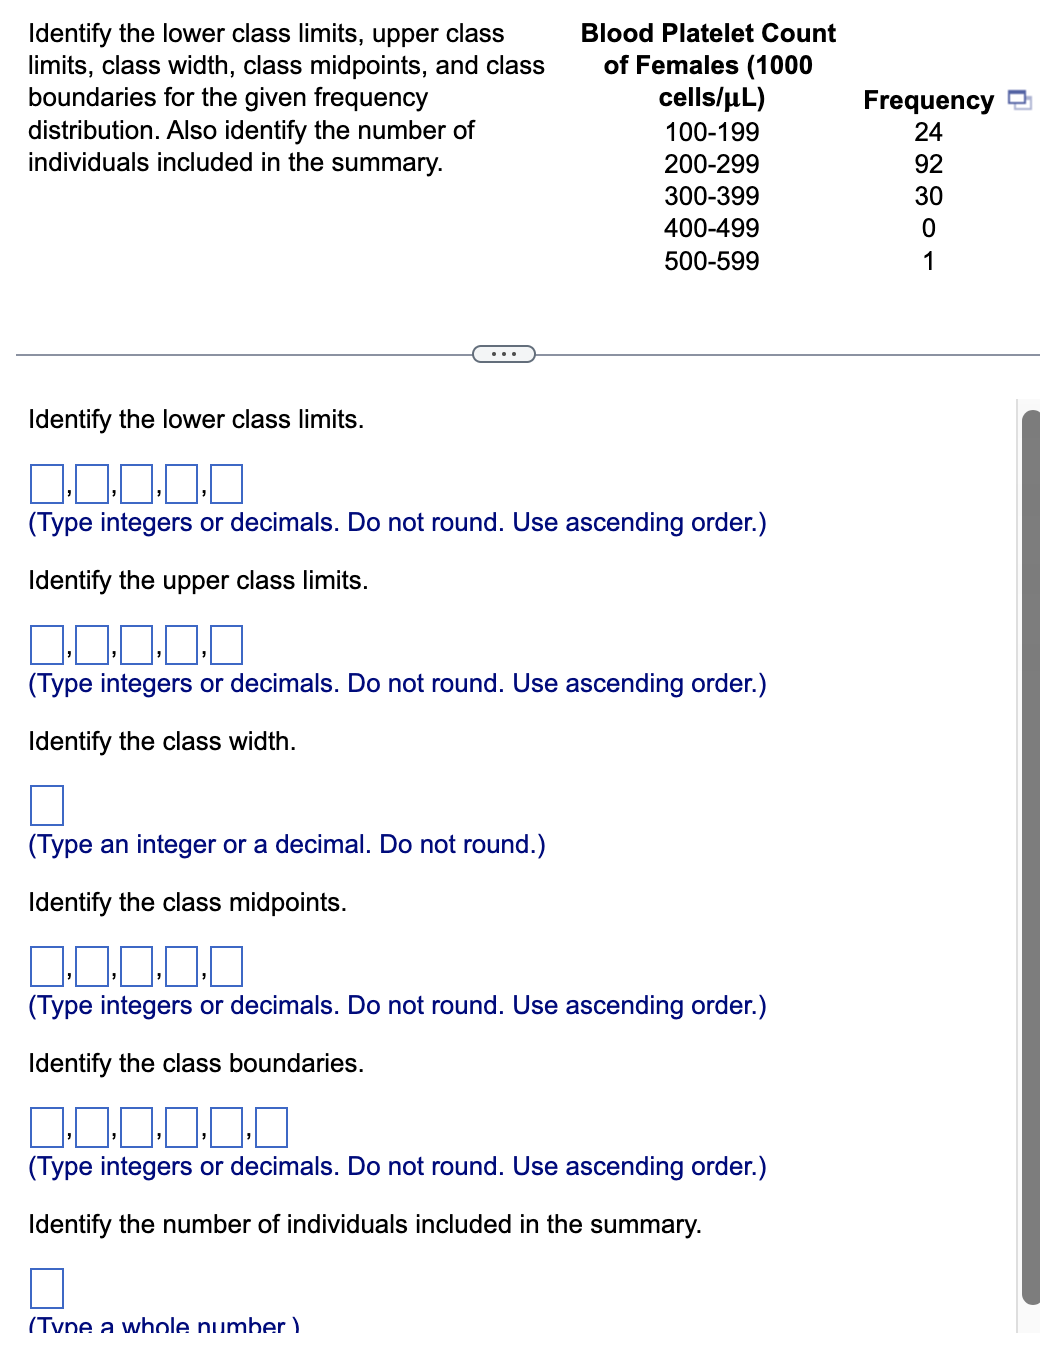

Transcribed Image Text:Identify the lower class limits, upper class
limits, class width, class midpoints, and class
boundaries for the given frequency
distribution. Also identify the number of
individuals included in the summary.
Blood Platelet Count
of Females (1000
cells/µL)
100-199
200-299
300-399
400-499
500-599
Identify the lower class limits.
0.0.0.0.0
(Type integers or decimals. Do not round. Use ascending order.)
Identify the upper class limits.
0.0.0.0.0
(Type integers or decimals. Do not round. Use ascending order.)
Identify the class width.
(Type an integer or a decimal. Do not round.)
Identify the class midpoints.
0.0.0.0.0
(Type integers or decimals. Do not round. Use ascending order.)
Identify the class boundaries.
(Tyne a whole number)
0.00000
(Type integers or decimals. Do not round. Use ascending order.)
Identify the number of individuals included in the summary.
Frequency
24
92
30
0
1
Expert Solution
This question has been solved!
Explore an expertly crafted, step-by-step solution for a thorough understanding of key concepts.

Step by stepSolved in 3 steps

Knowledge Booster

Similar questions
- Use the same scales to construct boxplots for the pulse rates of males and females from the accompanying data sets. Use the boxplots to compare the two data sets. Click the icon to view the data sets. 40 50 60 70 80 90 100110 40 50 60 70 80 90 100110 OC. D. 40 50 60 70 80 90 100110 40 50 60 70 80 90 100110 Determine the boxplot for the women's boxplot data. A. В. 40 50 60 70 80 90 100110 40 50 60 70 80 90 100110 OC. OD. 40 50 60 70 80 90 100110 40 50 60 70 80 90 100110arrow_forwardPlease do not give solution in image format thanku A car salesman collected data on how many cars were sold at a dealership per day for two weeks. The results were as follows: 6, 7, 4, 3, 1, 2, 6, 6, 6, 7, 4, 4. Make a frequency table and then make a histogram based on that frequency table. What is the shape of the distribution? O Skewed to the right O Skewed to the left O Bimodal O Symmetricalarrow_forwarddentify the class width, class midpoints, and class boundaries for the given frequency distribution.White blood cell count of malesFrequency 3.0-5.986.0-8.9159.0-11.91112.0-14.9515.0-17.91Question content area bottomPart 1What is the class width?enter your response here(Type an integer or a decimal.)Part 2What are the class midpoints?enter your response here,enter your response here,enter your response here,enter your response here,enter your response here(Type integers or decimals. Use ascending order.)Part 3What are the class boundaries?enter your response here,enter your response here,enter your response here,enter your response here,enter your response here,enter your response here(Type integers or decimals. Use ascending order.)arrow_forward
- Data was collected for 300 fish from the North Atlantic. The length of the fish (in mm) is summarized in the frequency distribution below. Lengths (mm) Frequency 180 - 184 1 185 - 189 16 190 - 194 71 195 - 199 108 200 - 204 83 205 - 209 18 210 - 214 3 What is the lower class boundary for the first class?class boundary =arrow_forwardFourteen different second-year medical students at a hospital measured the blood pressure of the same person. The systolic readings (mm Hg) are listed below. Use the given data to construct a boxplot and identify the 5-number summary. 133 128 135 137 120 125 148 130 147 136 126 140 144 150 The 5-number summary is . (Use ascending order. Type integers or decimals. Do not round.) and all in mm Hg. Which boxplot below represents the data? O A. O B. 130 150 120 130 140 150 E 120 140 Blood Pressure (mm Hg) Blood Pressure (mm Hg) O D. Oc. 120 130 140 150 C 120 130 140 150 C Blood Pressure (mm Hg) Blood Pressure (mm Hg)arrow_forwardNc Please don't provide the handwriting solutionarrow_forward
- Approximate the mean of the frequency distribution for the ages of the residents of a town. Age Frequency 0-9 31 10-19 27 20-29 14 30-39 20 40-49 22 50-59 43 60-69 46 70-79 11 80-89 7 What is the approximate mean age in years.arrow_forwardFind the mean, the median, and the mode(s), if any, for the given data. Round noninteger means to the nearest tenth. (If there is more than one mode, enter your answer as a comma-separated list. If an answer does not exist, enter DNE.) 27, 31, 20, 46, 36, 6, 55, 11 mean median mode(s)arrow_forwardUse the Histogram tool to develop a frequency distribution and histogram for the number of months as a customer of the bank in the data below. Compute the relative and cumulative relative frequencies and use a line chart to construct an ogive. Complete the frequency distribution for the months as a customer, and compute the relative and cumulative relative frequencies. (Type integers or decimals rounded to three decimal places as needed.) Bins Frequency Relative Frequency Cumulative Relative Frequency 10 enter your response here enter your response here enter your response here 20 enter your response here enter your response here enter your response here 30 enter your response here enter your response here enter your response here 40 enter your response here enter your response here enter your response here 50 enter your response here enter your response here enter your…arrow_forward
- Find the mean for the set of grouped data. The mean is (Round to two decimal places if needed.) Interval 0.5-2.5 2.5-4.5 4.5-6.5 6.5-8.5 Frequency 1 8 5 1arrow_forwardHow many classes are there and what is the class width?arrow_forward−13,−13,−13,0,0,0,11−13,−13,−13,0,0,0,11 Determine if the data set is unimodal, bimodal, multimodal, or has no mode. Identify the mode(s), if any exist.arrow_forward
arrow_back_ios
SEE MORE QUESTIONS
arrow_forward_ios
Recommended textbooks for you
- MATLAB: An Introduction with ApplicationsStatisticsISBN:9781119256830Author:Amos GilatPublisher:John Wiley & Sons Inc
 Probability and Statistics for Engineering and th...StatisticsISBN:9781305251809Author:Jay L. DevorePublisher:Cengage Learning
 Statistics for The Behavioral Sciences (MindTap C...StatisticsISBN:9781305504912Author:Frederick J Gravetter, Larry B. WallnauPublisher:Cengage Learning
  Elementary Statistics: Picturing the World (7th E...StatisticsISBN:9780134683416Author:Ron Larson, Betsy FarberPublisher:PEARSON
 The Basic Practice of StatisticsStatisticsISBN:9781319042578Author:David S. Moore, William I. Notz, Michael A. FlignerPublisher:W. H. Freeman
 Introduction to the Practice of StatisticsStatisticsISBN:9781319013387Author:David S. Moore, George P. McCabe, Bruce A. CraigPublisher:W. H. Freeman
MATLAB: An Introduction with Applications
Statistics
ISBN:9781119256830
Author:Amos Gilat
Publisher:John Wiley & Sons Inc
Probability and Statistics for Engineering and th...
Statistics
ISBN:9781305251809
Author:Jay L. Devore
Publisher:Cengage Learning
Statistics for The Behavioral Sciences (MindTap C...
Statistics
ISBN:9781305504912
Author:Frederick J Gravetter, Larry B. Wallnau
Publisher:Cengage Learning
Elementary Statistics: Picturing the World (7th E...
Statistics
ISBN:9780134683416
Author:Ron Larson, Betsy Farber
Publisher:PEARSON
The Basic Practice of Statistics
Statistics
ISBN:9781319042578
Author:David S. Moore, William I. Notz, Michael A. Fligner
Publisher:W. H. Freeman
Introduction to the Practice of Statistics
Statistics
ISBN:9781319013387
Author:David S. Moore, George P. McCabe, Bruce A. Craig
Publisher:W. H. Freeman