
MATLAB: An Introduction with Applications
6th Edition
ISBN: 9781119256830
Author: Amos Gilat
Publisher: John Wiley & Sons Inc
expand_more
expand_more
format_list_bulleted
Related questions
Question
Identify the lower class limits, upper class limits, class width, class midpoints, and class boundaries for the given frequency distribution. Also identify the number of individuals included in the summary

Transcribed Image Text:Pa
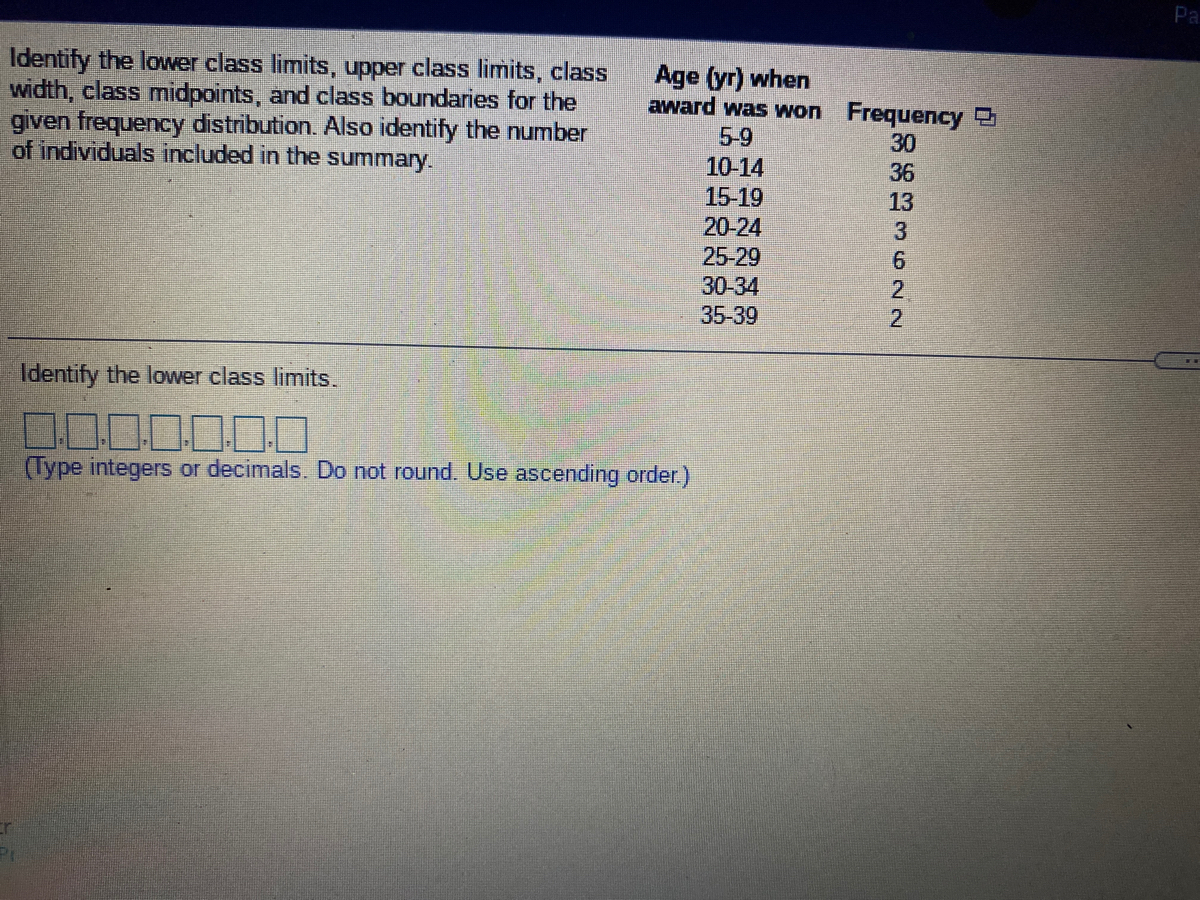
Identify the lower class limits, upper class limits, class
width, class midpoints, and class boundaries for the
given frequency distribution. Also identify the number
of individuals included in the summary.
Age (yr) when
award was won Frequency
5-9
10-14
15-19
30
36
13
20-24
25-29
6.
30-34
35-39
Identify the lower class limits.
0000000
(Type integers or decimals. Do not round. Use ascending order.)
cr
Expert Solution
This question has been solved!
Explore an expertly crafted, step-by-step solution for a thorough understanding of key concepts.

This is a popular solution

Trending nowThis is a popular solution!

Step by stepSolved in 2 steps

Knowledge Booster


Learn more about
Need a deep-dive on the concept behind this application? Look no further. Learn more about this topic, statistics and related others by exploring similar questions and additional content below.Similar questions
- Identify the lower class limits, upper class limits, class width, class midpoints, and class boundaries for the given frequency distribution. Also identify the number of individuals included in the summary. Age (yr) when award was won 15-19 20-24 25-29 30-34 35-39 40-44 45-49 ... Identify the lower class limits. 0.0.0.0.0.0.0 (Type integers or decimals. Do not round. Use ascending order.) Frequency 30 36 16 3 5 1 1arrow_forwardIdentify the lower class limits, upper class limits, class width, class midpoints, and class boundaries for the given frequency distribution. Also identify the number of individuals included in the summary. a. Identify the lower class limits (in 1000cells/muL). (Type integers or decimals. Do not round. Use ascending order.) b. Identify the upper class limits (in 1000 cells/muL). (Type integers or decimals. Do not round. Use ascending order.) c. Identify the class width (in 1000 cells/muL). (Type an integer or a decimal. Do not round.) d. Identify the class midpoints (in 1000cells/muL). (Type integers or decimals. Do not round. Use ascending order.) e. Identify the class boundaries (in 1000cells/muL). (Type integers or decimals. Do not round. Use ascending order.) f. Identify the number of individuals included in the summary. (Type an integer or a decimal. Do not round.)arrow_forwardSelect the correct answer and write the appropriate letter in the space provided _____ 1. A grouping of data into classes giving the number of observations in each class is called a(an) a bar chart. b. frequency distribution. c. pie chart. d. cumulative frequency distribution. ______ 2. The distance between consecutive lower class limits is called the a. class interval. b. frequency distribution. c. class midpoint. d. class frequency. ______ 3. The class midpoint is a. equal to the number of observations. b. found by adding the lower class limits of two consecutive classes and dividing by 2. c. equal to the class interval. d. all of the above. ______ 4. The number of observations in a particular class is called the a. class interval. b. class frequency. c. frequency distribution. d. none of the above. ______ 5. A bar chart is used most often when a. you want to show frequencies as compared to total observations. b. you want to show…arrow_forward
- One of the primary goals of constructing a frequency distribution for quantitative data is to summarize the data O by showing frequency of values that lie within a class or bin. O so that there are always 7 classes or bins of data. O ensuring that the classes or bins are always of different widths. O in a manner so that each class or bin has the same number of data points.arrow_forward3. Construct frequency distribution, with 6 classes. Also find class boundaries, mid points, relative frequency and cumulative frequency of each class. 65 91 85 76 85 87 79 93 82 75 100 70 88 83 59 87 69 89 54 74 89 80 94 67 77 92 82 70 94 84 96 98 46 70 90 96 88 72arrow_forwardData was collected for 225 fish from the North Atlantic. The length of the fish (in cm) is summarized in the histogram below. 40 35 30 25 20 15 10 15 30 45 60 75 90 105 120 length of fish (cm) Based on the Histogram above, reconstruct the corresponding Frequency Distribution Table Class Frequency Áuənbəsarrow_forward
arrow_back_ios
arrow_forward_ios
Recommended textbooks for you
- MATLAB: An Introduction with ApplicationsStatisticsISBN:9781119256830Author:Amos GilatPublisher:John Wiley & Sons Inc
 Probability and Statistics for Engineering and th...StatisticsISBN:9781305251809Author:Jay L. DevorePublisher:Cengage Learning
 Statistics for The Behavioral Sciences (MindTap C...StatisticsISBN:9781305504912Author:Frederick J Gravetter, Larry B. WallnauPublisher:Cengage Learning
  Elementary Statistics: Picturing the World (7th E...StatisticsISBN:9780134683416Author:Ron Larson, Betsy FarberPublisher:PEARSON
 The Basic Practice of StatisticsStatisticsISBN:9781319042578Author:David S. Moore, William I. Notz, Michael A. FlignerPublisher:W. H. Freeman
 Introduction to the Practice of StatisticsStatisticsISBN:9781319013387Author:David S. Moore, George P. McCabe, Bruce A. CraigPublisher:W. H. Freeman
MATLAB: An Introduction with Applications
Statistics
ISBN:9781119256830
Author:Amos Gilat
Publisher:John Wiley & Sons Inc
Probability and Statistics for Engineering and th...
Statistics
ISBN:9781305251809
Author:Jay L. Devore
Publisher:Cengage Learning
Statistics for The Behavioral Sciences (MindTap C...
Statistics
ISBN:9781305504912
Author:Frederick J Gravetter, Larry B. Wallnau
Publisher:Cengage Learning
Elementary Statistics: Picturing the World (7th E...
Statistics
ISBN:9780134683416
Author:Ron Larson, Betsy Farber
Publisher:PEARSON
The Basic Practice of Statistics
Statistics
ISBN:9781319042578
Author:David S. Moore, William I. Notz, Michael A. Fligner
Publisher:W. H. Freeman
Introduction to the Practice of Statistics
Statistics
ISBN:9781319013387
Author:David S. Moore, George P. McCabe, Bruce A. Craig
Publisher:W. H. Freeman